1073 June Dr
Melbourne, FL 32935
$169,000D
2 bd · 1.5 ba ·
1,301 sqft ·
Built 1984
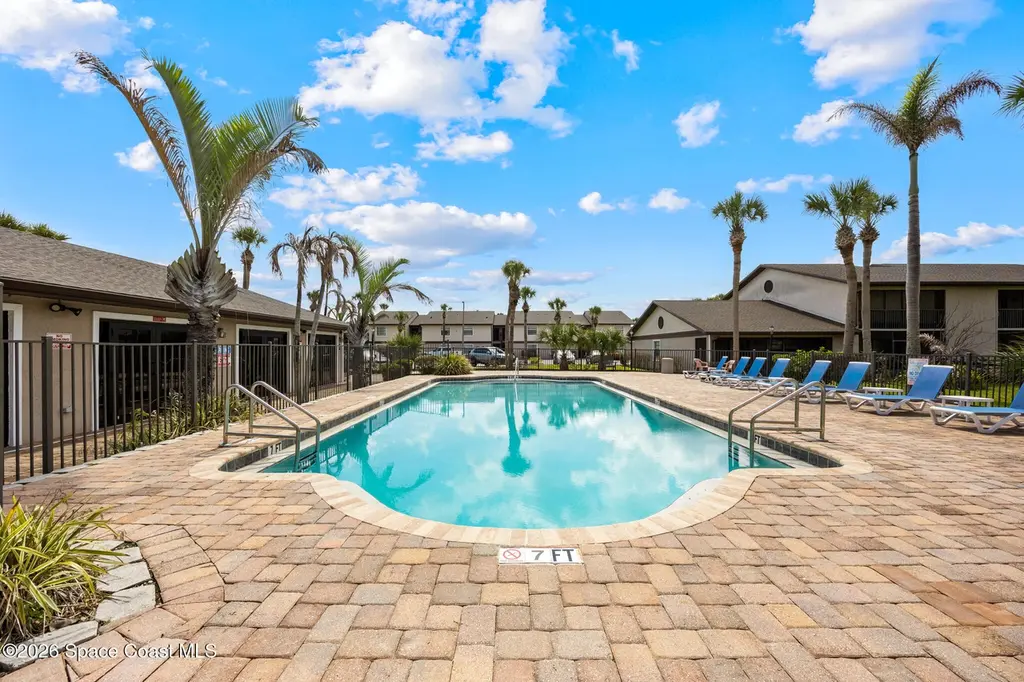
· Condo
· Active
· 17 DOM
Cashflow @ list (25.0% down · 7.5%)
Estimated rent
$1,847/mo
Mortgage (P&I)
−$886
Tax + insurance
−$182
HOA
−$393
Vac / Maint / Mgmt
−$388
Net cashflow
$-2/mo
Annual
$-29/yr
Cap rate
6.28%
Cash-on-cash
-0.06%
DSCR
1.00
1% rule
1.09%
Cash to close
$47,320
Investor read
- This is a 2-bed/1.5-bath condo listed at $169k.
- At list price, monthly cash flow is $-2 ($-29/yr) — negative.
- To cash-flow at today's rent, offer at most $169k (0.2% below list).
- Meets the 1% rule at list price ($2k rent vs $169k).
- It's been on market 17 days — a 2% lower offer ($166k) is reasonable based on typical stale-listing flexibility.
- Recommended offer: $166k (1.5% below list) — sets the bar for market timing.
- Local home prices are declining (-3.0%/yr); year-one equity from $1k of loan paydown is wiped out by about $5k of value loss. Plan a longer hold.
- Location reads: area grade D — affects rentability + tenant quality, not the cash-flow math above.
- Brevard (suburban): math 53% / reading 57% proficiency, ranked #19 of 73 in FL (top 26%) — acceptable for families but not a draw, mixed tenant base, ~2y average lease.
- Zoned schools: Sabal Elementary School (math 38% / reading 41%, grade F, #1,513 of 2,144 statewide, top 73%, 503 students, 69% FRL); Lyndon B. Johnson Middle School (math 40% / reading 42%, grade F, #353 of 571 statewide, top 63%, 610 students, 61% FRL); Eau Gallie High School (math 20% / reading 49%, grade F, #386 of 667 statewide, top 59%, 1,586 students, 55% FRL) — zoned schools average 62% FRL vs 43% district-wide (19 pts higher); higher-poverty schools than district average — tighter screening recommended.
- Zoned-school proficiency averages 38% at this address vs 55% district-wide (-17 pts) — the specific schools serving this property underperform the Brevard average; the district grade overstates school quality for this exact location.
- Watch-outs: HOA is 21% of rent.
- Market conditions: Rents flat; 335 active listings in the ZIP; 19 comparable units currently listed for rent nearby; rentals at typical pace (median 26d on market — plan ~3-4 weeks tenant-placement turnaround); 4,602 units permitted in Brevard County in 2024 (702 in 5+ unit buildings).
- Brevard County population projected at +15% by 2050 — modest demand growth; plan on rents tracking national, not racing it.
- 9 sale attempts since 3y ago with the ask held roughly flat each time — persistent listings suggest the price (not the market) is what's stuck; bring a comps-based counter.
- Current owner paid $57k; list at $169k implies a 196% gain — meaningful room to come down on a strong offer.
- Climate carrying-cost: severe wind risk, 99% chance of damaging wind over 30y; extreme-heat days projected 8→25/yr by 2055 (HVAC capex compounding) — expect insurance premiums to compound above CPI over the hold.
- This rent runs 34% of the median local income ($65k/yr) — at the standard rent-burdened threshold; future hikes will face affordability resistance.
Questions for listing agent
- What do current leases actually rent for vs. the listed asking? Can we see a recent rent roll and the last 12 months of T-12 income?
- What does the HOA fee cover, when was the last increase, and are there any pending special assessments or reserve-fund shortfalls?
- Any open or pending special assessments — roof, HVAC, plumbing, elevator, façade? What's the per-unit balance and payoff schedule, and is the seller paying it off at close or rolling it to the buyer?
- Is there a deadline driving the sale (1031 exchange, divorce, estate, relocation)? That informs how much negotiation room exists.
- The area grade is low — what's the realistic commute time and amenity access for the typical tenant pool here? Any planned neighborhood developments (good or bad) we should know about?
- What's the average days-on-market for RENTAL listings here right now (not sales)? A rising rental-DOM trend means longer vacancies and softer asking-rent achievability than the comps imply.
- What's the recent tenant-quality profile in this submarket — average credit score on applications, eviction rate, late-payment / NSF rate, and stable-employment percentage? A property-management company in the area should have these aggregated.
- How much new apartment / multifamily construction is in the pipeline within 1–3 miles? Heavy new supply (>2% of stock underway) typically softens rents 12–24 months out; light construction supports rent growth.
CashFlowRE · CFR-VRCG5Z9Q3DR4KX
· Data 12 h ago
cashflowre.app · 2026-05-29