1073 June Dr · Melbourne, FL
Flood risk 1/10 · Minimal
- FEMA flood zone
- X (unshaded)
- Chance of flooding over 30 yrs
- 0.0%
- Est. flood insurance / yr
- $507 – $1,088
Fire risk 2/10 · Minimal
- Est. fire insurance / yr
- $947 – $1,759
Heat risk 10/10 · Severe
- Hot days now (above 105°F)
- 8 days/yr
- Hot days in 30 yrs
- 25 days/yr
Wind risk 10/10 · Severe
- Chance of severe wind over 30 yrs
- 99.0%
Air-quality risk 1/10 · Minimal
- Unhealthy air days now
- 0 days/yr
- Unhealthy air days in 30 yrs
- 0 days/yr
Risk factors via First Street. Map © Google.
Why this score? — see what drove the D grade
The composite is a weighted blend of 9 inputs, each scored 0–100. Each bar is that input's sub-score; the figure is the points it added to the 100-point composite (weight × sub-score).
- Cash flow +13.2/30.0
- ARV discount +7.5/15.0
- 1% rule +5.9/10.0
- Schools +4.7/10.0
- DSCR +4.0/10.0
- Rent growth +2.6/5.0
- Livability +2.5/5.0
- Condition / age +2.5/5.0
- Appreciation +0.0/10.0
$169,000
🖨 Deal sheet (PDF) 📄 Offer letter ✓ Due diligence
Listing remarks MLS
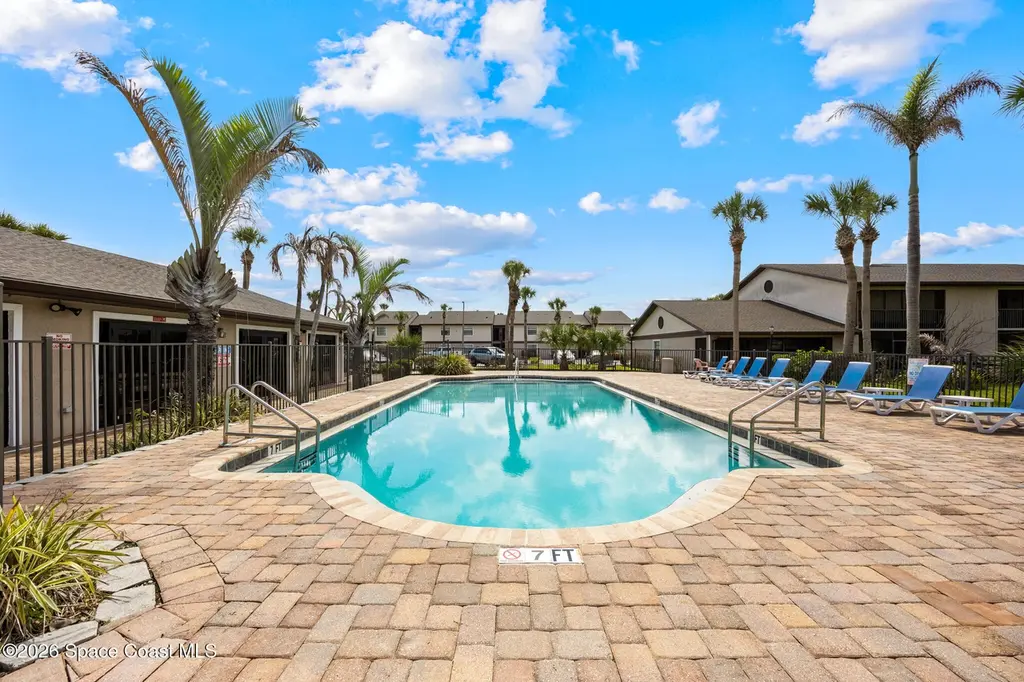
PRICE IMPROVEMENT! Welcome home to this central Melbourne 2 bedroom townhome with attached garage! This home has been loved and is ready for its next owner. You will enjoy spending the cooler evenings and mornings on your screened-in back patio, overlooking the green space. A tasteful, real hardwood staircase guides you upstairs to both bedrooms. The kitchen and living room remain on the first floor, offering plenty of space to host friends and family. The community has had lots of upgrades lately- at NO cost to homeowners. There have been no recent assessments here and none are planned, the HOA reserve is very healthy! The clubhouse was renovated, there is a new gym, and the pool area was renovated as well. Lastly, this location is truly central to it all. An easy drive to the beaches, I-95, and everything Melbourne & Brevard has to offer. This price for a townhome is hard to find for the great condition the home is in!
Key facts
- Community pool
- Renovated clubhouse
- Hardwood staircase
Tags
Property features AI
Finance
- HOA & community: Has association (Coral Gardens Melbourne, Inc.); Monthly association fee; Association amenities: Clubhouse, Fitness Center, Playground, Maintenance (grounds & structure), Trash; Association fee includes maintenance (grounds), pest control, trash
Exterior
- Parking: Assigned parking; Garage (1 space); Guest parking
- Utilities: Public sewer; Electricity connected; Sewer connected; Water connected
- Home design: Condominium; Two stories; Entry level is 1; Faces west; Current use: Residential / Single Family
- Construction: Block, concrete & stucco construction; Pets allowed
- Exterior features: Rear porch; Screened porch; Shingle roof; Lot features: Other
Interior
- Kitchen: Electric range; Dishwasher; Refrigerator
- Bedrooms: 2 bedrooms
- Flooring: Laminate; Tile; Wood
- Bathrooms: 1 full bathroom; 1 half bathroom; 2 total bathrooms
- Heating & cooling: Central heating; Central air
- Interior features: Breakfast bar; Ceiling fan(s); Pantry
- Laundry & utility: Washer; Dryer; Laundry in garage
Neighborhood map
What this means for you Summary
Snapshot
- This is a 2-bed/1.5-bath condo listed at $169k.
Deal economics
- At list price, monthly cash flow is $-2 ($-29/yr) — negative.
- To cash-flow at today's rent, offer at most $169k (0.2% below list).
- Meets the 1% rule at list price ($2k rent vs $169k).
- Recommended offer: $166k (1.5% below list) — sets the bar for market timing.
Location & tenants
- Location reads: area grade D — affects rentability + tenant quality, not the cash-flow math above.
- Brevard (suburban): math 53% / reading 57% proficiency, ranked #19 of 73 in FL (top 26%) — acceptable for families but not a draw, mixed tenant base, ~2y average lease.
- Zoned schools: Sabal Elementary School (math 38% / reading 41%, grade F, #1,513 of 2,144 statewide, top 73%, 503 students, 69% FRL); Lyndon B. Johnson Middle School (math 40% / reading 42%, grade F, #353 of 571 statewide, top 63%, 610 students, 61% FRL); Eau Gallie High School (math 20% / reading 49%, grade F, #386 of 667 statewide, top 59%, 1,586 students, 55% FRL) — zoned schools average 62% FRL vs 43% district-wide (19 pts higher); higher-poverty schools than district average — tighter screening recommended.
- Zoned-school proficiency averages 38% at this address vs 55% district-wide (-17 pts) — the specific schools serving this property underperform the Brevard average; the district grade overstates school quality for this exact location.
- Market conditions: Rents flat; 335 active listings in the ZIP; 19 comparable units currently listed for rent nearby; rentals at typical pace (median 25d on market — plan ~3-4 weeks tenant-placement turnaround); 4,602 units permitted in Brevard County in 2024 (702 in 5+ unit buildings).
- This rent runs 34% of the median local income ($65k/yr) — at the standard rent-burdened threshold; future hikes will face affordability resistance.
Forward outlook
- Local home prices are declining (-3.0%/yr); year-one equity from $1k of loan paydown is wiped out by about $5k of value loss. Plan a longer hold.
- Brevard County population projected at +15% by 2050 — modest demand growth; plan on rents tracking national, not racing it.
Negotiation context
- It's been on market 17 days — a 2% lower offer ($166k) is reasonable based on typical stale-listing flexibility.
- 9 sale attempts since 3y ago with the ask held roughly flat each time — persistent listings suggest the price (not the market) is what's stuck; bring a comps-based counter.
- Current owner paid $57k; list at $169k implies a 196% gain — meaningful room to come down on a strong offer.
Risks & watch-outs
- Watch-outs: HOA is 21% of rent.
- Climate carrying-cost: severe wind risk, 99% chance of damaging wind over 30y; extreme-heat days projected 8→25/yr by 2055 (HVAC capex compounding) — expect insurance premiums to compound above CPI over the hold.
Questions for the listing agent
- What do current leases actually rent for vs. the listed asking? Can we see a recent rent roll and the last 12 months of T-12 income?
- What does the HOA fee cover, when was the last increase, and are there any pending special assessments or reserve-fund shortfalls?
- Any open or pending special assessments — roof, HVAC, plumbing, elevator, façade? What's the per-unit balance and payoff schedule, and is the seller paying it off at close or rolling it to the buyer?
- Is there a deadline driving the sale (1031 exchange, divorce, estate, relocation)? That informs how much negotiation room exists.
- The area grade is low — what's the realistic commute time and amenity access for the typical tenant pool here? Any planned neighborhood developments (good or bad) we should know about?
- What's the average days-on-market for RENTAL listings here right now (not sales)? A rising rental-DOM trend means longer vacancies and softer asking-rent achievability than the comps imply.
- What's the recent tenant-quality profile in this submarket — average credit score on applications, eviction rate, late-payment / NSF rate, and stable-employment percentage? A property-management company in the area should have these aggregated.
- How much new apartment / multifamily construction is in the pipeline within 1–3 miles? Heavy new supply (>2% of stock underway) typically softens rents 12–24 months out; light construction supports rent growth.
Investment metrics
- 1% rule
- 1.09% ✓
- Cap rate
- 6.28%
- Cash-on-cash
- -0.06%
- DSCR
- 1.00
- GRM
- 7.6
CMA / ARV
No comps found within radius.
Projected returns pro-forma
-3.0% appreciation · 0.53% rent growth · sell at horizon
- IRR
- -19.8%
- Equity multiple
- 0.33×
- Total profit
- $-31,809
- Equity at exit
- $25,198
- IRR
- -21.0%
- Equity multiple
- 0.06×
- Total profit
- $-44,545
- Equity at exit
- $14,612
Cash invested: $47,320 (down + closing). Projections, not guarantees.
Landlord ↔ Tenant lean methodology
- Overall (STATE)
- 87 Strongly Landlord-Friendly
- State Florida
- 87 Strongly Landlord-Friendly · R+3
- County
- — inherits STATE
- City
- — inherits STATE
ZIP-level market 32935
- Rents YoY
- 0.5%
- Active inventory
- 335
- Price-to-rent
- 7.6×
Monthly cashflow live
- Estimated rent
- $1,847 high interval (Pro) →
- Mortgage (P&I)
- −$886
- Tax from tax record
- −$112 /mo · $1,343/yr
- Insurance
- −$70
- HOA
- −$393
- Vacancy / Maint / Mgmt
- −$388
- Net cashflow
- $-2
Break-even live
Sensitivity live
| Price | -10% $93 | -5% $45 | +0% $-2 | +5% $-50 | +10% $-98 |
|---|---|---|---|---|---|
| Rent | -10% $-148 | -5% $-75 | +0% $-2 | +5% $71 | +10% $144 |
| Rate | -1.0pp $83 | -0.5pp $41 | base $-2 | +0.5pp $-46 | +1.0pp $-91 |
UW: 25.0% down · 7.5% · 30yr · 1.5% tax · 5.0% vac · 8.0% maint · 8.0% mgmt
Financing live
Cash to close
- Down payment
- $42,250
- Closing costs
- $5,070
- Reserves months
- —
- Total cash needed
- —
Loan-product check · same deal, 3 products live
Conventional
25% down · 7.5% · 30yr
- Down + closing
- —
- Monthly P&I
- —
- Monthly cashflow
- —
- DSCR
- —
- Eligible?
- —
Personal DTI + credit; lowest rate.
DSCR
20% down · 8.5% · 30yr
- Down + closing
- —
- Monthly P&I
- —
- Monthly cashflow
- —
- DSCR
- —
- Eligible?
- —
No personal income docs; deal must DSCR.
Hard money
10% down · 12.0% · 12mo
- Down + closing
- —
- Monthly P&I
- —
- Monthly cashflow
- —
- DSCR
- —
- Eligible?
- —
Short-term bridge; refi at stabilization.
Rent comps 19 comps
| Address | Beds | Baths | Sqft | Rent | $/sqft | DOM | Units | Dist |
|---|---|---|---|---|---|---|---|---|
| 2794 Rhonda Ln Melbourne, FL | 2.0 | 2.0 | 996 | $1,900 | $1.91 | 25d | 1 | 0.07mi |
| 2659 Burns Ave Melbourne, FL | 3.0 | 1.0 | 1044 | $1,850 | $1.77 | 25d | 1 | 0.22mi |
| 2806 Tropic Rd Unit 1 Melbourne, FL | 3.0 | 2.0 | 1705 | $1,600 | $0.94 | 23d | 1 | 0.28mi |
| 848 Comanche Ave Melbourne, FL | 3.0 | 2.0 | 1080 | $1,950 | $1.81 | 25d | 1 | 0.43mi |
| 653 Ridge Club Dr #27 Melbourne, FL | 2.0 | 1.5 | 900 | $1,550 | $1.72 | 25d | 1 | 0.63mi |
| 512 Dijon Dr Melbourne, FL | 3.0 | 2.0 | 1800 | $2,450 | $1.36 | 25d | 1 | 0.63mi |
| 500 N Wickham Rd Melbourne, FL | 2.0 | 2.0 | 1000 | $1,449 | $1.45 | 16d | 8 | 0.70mi |
| 608 Cheyenne Ave Melbourne, FL | 2.0 | 2.0 | 1299 | $2,000 | $1.54 | 16d | 1 | 0.74mi |
| 2137 Laden Rd Melbourne, FL | 3.0 | 2.0 | 1248 | $2,100 | $1.68 | 25d | 1 | 0.82mi |
| 1758 Caleb Ln Melbourne, FL | 3.0 | 2.0 | 1400 | $2,350 | $1.68 | 15d | 1 | 1.01mi |
| 1965 Barkley Ave Melbourne, FL | 3.0 | 1.0 | 1000 | $1,600 | $1.60 | 25d | 1 | 1.06mi |
| 1795 Kole Pl #109 Melbourne, FL | 3.0 | 2.5 | 1472 | $1,950 | $1.32 | 25d | 1 | 1.23mi |
| 1430 Isabella Dr #102 Melbourne, FL | 3.0 | 2.5 | 1510 | $2,250 | $1.49 | 25d | 1 | 1.26mi |
| 1455 Isabella Dr #101 Melbourne, FL | 3.0 | 2.5 | 1606 | $2,275 | $1.42 | 25d | 1 | 1.29mi |
| 1688 Eisenhower Ave Melbourne, FL | 3.0 | 1.5 | 988 | $1,700 | $1.72 | 25d | 1 | 1.29mi |
| 758 Ixora Dr Melbourne, FL | 3.0 | 2.5 | 1664 | $2,700 | $1.62 | 25d | 1 | 1.37mi |
| 2153 Royal Poinciana Blvd Melbourne, FL | 3.0 | 2.5 | 1732 | $2,600 | $1.50 | 25d | 1 | 1.41mi |
| 2242 Flower Tree Cir Melbourne, FL | 2.0 | 2.0 | 879 | $1,300 | $1.48 | 25d | 1 | 1.42mi |
| 2323 Golf Lake Cir #1111 Melbourne, FL | 2.0 | 2.0 | 1140 | $1,600 | $1.40 | 21d | 1 | 1.47mi |
HOA detail condo
- Monthly dues
- $393 · $4,716/yr
- Likely covers
- poolgym
- Assessments
- None detected in remarks — confirm with the listing agent.
Listing history 12 events
-
2026-06-22days on market $169,000 Active 17 DOM
-
2026-06-18days on market $169,000 Active 14 DOM
-
2026-06-17price $169,000 Active 13 DOM
-
2026-06-17days on market $175,000 Active 13 DOM
-
2026-06-16days on market $175,000 Active 12 DOM
-
2026-06-15days on market $175,000 Active 11 DOM
-
2026-06-14days on market $175,000 Active 9 DOM
-
2026-06-10days on market $175,000 Active 6 DOM
-
2026-06-08days on market $175,000 Active 4 DOM
-
2026-06-07days on market $175,000 Active 3 DOM
-
2026-06-05remarks 699-char remark
-
2026-06-05$175,000 Active 1 DOM
ⓘ Source: listings_history table (triggers on properties + properties_extension) + one-shot
backfill from property_details.listing_events for pre-trigger history.
Tax reassessment forecast FL · Resets to sale price
- Current annual tax
- $1,343 · $112/mo
- Projected year-2 tax
- $1,403 · $117/mo
- Expected delta
- +$59/yr (+$5/mo · 4.4%)
ⓘ Screening estimate from a state-policy table — verify with the county assessor before closing.
Climate risk First Street
- Flood 1/10 Low FEMA zone X (unshaded) · 0% chance over 30 yrs
- Wildfire 2/10 Low
- Heat 10/10 Extreme 8 d/yr ≥105°F today · 25 d/yr by 30 yrs out
- Wind 10/10 Extreme 99% chance of damaging wind over 30 yrs
- Air quality 1/10 Low 0 unhealthy d/yr today · 0 by 30 yrs out
Nearby sold comps map
Loading sold comps map…
Walkable amenities ~0.75 mi
Loading nearby amenities…
Taxation est. · year 1
- Rental income
- $22,165
- − Mortgage interest
- −$9,467
- − Property taxes
- −$1,343
- − Insurance
- −$845
- − Repairs & maintenance
- −$1,773
- − Management
- −$1,773
- − HOA
- −$4,716
- − Depreciation
- −$4,916
- Taxable loss
- −$2,668
- Est. tax savings @ 24.0%
- +$640
- After-tax cash flow
- $612/yr
For passive investors: Depreciation is non-cash, so a rental often shows a tax loss while cash-flowing — sheltering income. Rental losses are passive: they offset passive income freely, and up to $25,000/yr can offset ordinary (W-2) income if you actively participate and your MAGI is under $100k (phasing out to $0 by $150k); unused losses carry forward. On sale, claimed depreciation is recaptured at up to 25%, and gains may owe capital-gains tax (a 1031 exchange can defer both). Figures are a year-1 estimate at your 24.0% rate — not tax advice; consult a CPA.
Schools (NCES district)
- District
- Brevard
- NCES district ID
- 1200150
- Math proficiency
- 53% ▼ -9.00%
- Reading proficiency
- 57% ▼ -4.00%
- Median HH income
- $49,426
- Composite
- 46.86/100
- National rank
- #2370
- State rank
- #19 of 73 in FL
Livability — Melbourne
No livability data for this city. (Only ~50 U.S. cities are tracked.)
Census & demographics
- Census place
- Melbourne, FL
- County
- Brevard County · 602,871 people
- City population
- 178,420
- Metro
- Palm Bay-Melbourne-Titusville, FL
- Population (ZIP)
- 41,965
- Household income
- $64,588
- Rent vs Own
- Severe rent burden
- 1747.0
Population outlook (Brevard County) Hauer SSP2
- Today (2025)
- 623,254 people
- By 2030
- 648,420 · +4.0%
- By 2040
- 690,009 · +10.7%
- By 2050
- 715,669 · +14.8%
- By 2075
- 775,744 · +24.5%
- By 2100
- 776,687 · +24.6%
Race, ethnicity, and origin ACS 2023
- Neighborhood character
- Predominantly White (74%)
- Race & ethnicity
- White 74% Hispanic / Latino 13% Two or more races 9% Black 5% Asian 2%
- Hispanic origin (detail)
- Mexican 3% Puerto Rican 5%
- Common ancestry
- Slovak 2% Romanian 2% Lithuanian 2%
- Foreign-born
- 9% · Canada, Vietnam, Jamaica
- Languages at home
- 88% English-only · Spanish 8% Other Indo-European 1% Tagalog/Filipino 1%
Political lean MEDSL · Brevard
- 2024 margin
- Strong R (+20.8) · D 39.1% · R 59.9% · Other 1.0%
- 2008→2024 swing
- -10.4pp toward R · 2008: -10.4pp · 2024: -20.8pp
- All cycles
- 2024: R+20.8 2020: R+16.4 2016: R+19.8 2012: R+12.7 2008: R+10.4
Not yet ingested
- Civics
- —
Market trends
- HPI YoY
- ▼ -185.48%
- Current HPI
- 308.7443
- Rent YoY
- ▲ 0.53%
- Metro
- Palm Bay-Melbourne-Titusville, FL
- State GDP YoY
- ▲ 3.28%
- F500 in state
- 36
Industry mix (Fortune 500 HQ in FL)
| Industry | F500 HQs | Revenue |
|---|---|---|
| Industrial Technology | 2 | $29B |
|
||
| Insurance | 2 | $17B |
|
||
| Retail | 1 | $60B |
|
||
| Technology Distribution | 1 | $58B |
|
||
| Homebuilding | 1 | $35B |
|
||
| Technology Manufacturing | 1 | $35B |
|
||
Price history
-98.6% since first listed23 events — show timeline
- 2026-06-04 Listed $175,000 SCMLS
- 2025-04-25 Relisted — SCMLS
- 2025-04-10 Contingent — SCMLS
- 2025-04-03 Relisted — SCMLS
- 2025-03-05 Pending — SCMLS
- 2025-03-05 Listing Removed — SCMLS
- 2025-03-05 Relisted — SCMLS
- 2025-03-03 Listing Removed — SCMLS
- 2025-02-01 Contingent — SCMLS
- 2025-01-31 Listing Removed — SCMLS
- 2025-01-03 Relisted — SCMLS
- 2024-12-31 Listing Removed — SCMLS
- 2024-11-11 Price Changed $179,900 SCMLS
- 2024-10-23 Relisted — SCMLS
- 2024-08-28 Contingent — SCMLS
- 2024-08-15 Relisted — SCMLS
- 2024-08-05 Contingent — SCMLS
- 2024-06-27 Listed $189,000 SCMLS
- 2024-05-24 Listing Removed — SCMLS
- 2024-04-01 Price Changed $189,000 SCMLS
- 2023-11-24 Listed $195,000 SCMLS
- 2010-05-25 Sold (Public Records) $57,000 Public Records
- 2008-12-31 Sold (Public Records) $12,575,200 Public Records
Property tax history
+5.3%/yrLatest (2025): $1,343 · +6.7% YoY. Source: county tax records.
Cash-flow waterfall
monthlySold comps — $/sqft
last 12 mo · ≤1 miLoading sold comps…