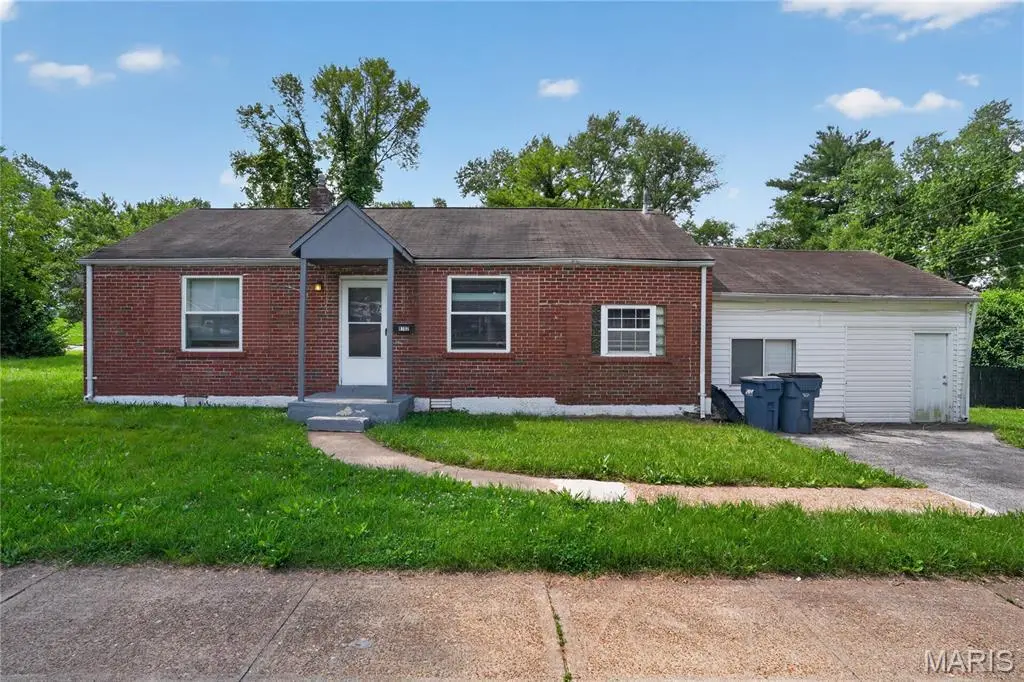
8102 Frost Ave
Berkeley, MO 63134
$94,900B
3 bd · 1.0 ba ·
1,180 sqft ·
Built 1949
· SingleFamily
· Active
· 14 DOM
Cashflow @ list (25.0% down · 7.5%)
Estimated rent
$1,396/mo
Mortgage (P&I)
−$498
Tax + insurance
−$97
HOA
−$0
Vac / Maint / Mgmt
−$293
Net cashflow
$508/mo
Annual
$6,093/yr
Cap rate
12.71%
Cash-on-cash
22.93%
DSCR
2.02
1% rule
1.47%
Cash to close
$26,572
Investor read
- This is a 3-bed/1.0-bath single-family listed at $95k.
- At list price, monthly cash flow is $508 ($6k/yr) — positive.
- The deal already cash-flows at list — no discount required.
- Meets the 1% rule at list price ($1k rent vs $95k).
- Only 14 days on market — expect competitive offers; lowballing is unlikely to land.
- Local home prices are declining (-3.0%/yr); year-one equity from $656 of loan paydown is wiped out by about $3k of value loss. Plan a longer hold.
- Location reads 54/100 on livability (#774 in MO) — a working-class tenant base; expect higher turnover. Strengths: cost of living A+, housing A; Watch: health & safety C-, crime F, amenities F.
- Ferguson-Florissant R-II (suburban): math 7% / reading 20% proficiency, ranked #311 of 324 in MO (top 96%) — low school quality limits family demand, transient renter base, plan for 1-2y turnover; 70% free/reduced lunch — lower-income household profile, screen leases tightly.
- Zoned schools: Berkeley Elementary School (math 4% / reading 13%, grade F, #1,050 of 1,115 statewide, top 94%, 346 students, 99% FRL); Mccluer High (math 0% / reading 17%, grade F, #511 of 521 statewide, top 98%, 1,181 students, 100% FRL) — zoned schools average 99% FRL vs 70% district-wide (30 pts higher); higher-poverty schools than district average — tighter screening recommended.
- Watch-outs: built in 1949 — expect roof / HVAC / electrical / plumbing capex.
- Market conditions: Rents rising (+1.6%/yr); 70 active listings in the ZIP; 40 comparable units currently listed for rent nearby; rentals at typical pace (median 24d on market — plan ~3-4 weeks tenant-placement turnaround); lower-income renter base — watch delinquency; 920 units permitted in St. Louis County in 2024 (250 in 5+ unit buildings).
- At projected returns (-3.0% appreciation + 1.6% rent growth), your $27k cash investment doubles in ~6 years — after that, you're playing with house money.
- Cap rate 12.7% vs local median 10.1% in Berkeley — meaningfully above typical; check what's discounted (condition, days-on-market, listing class) to confirm the premium yield is real.
- This rent runs 37% of the median local income ($45k/yr) — at the standard rent-burdened threshold; future hikes will face affordability resistance.
Questions for listing agent
- Built in 1949 — when were the roof, HVAC, electrical panel, plumbing, and water heater last replaced?
- Is there a deadline driving the sale (1031 exchange, divorce, estate, relocation)? That informs how much negotiation room exists.
- Schools are F-rated, which usually means shorter tenancies and higher turnover. Who's the typical renter profile here, and what's been the actual vacancy rate?
- Crime grade is F in this area — have there been break-ins, vandalism, or insurance claims at this property in the last 3 years? What carrier currently insures it and at what premium?
- What's the average days-on-market for RENTAL listings here right now (not sales)? A rising rental-DOM trend means longer vacancies and softer asking-rent achievability than the comps imply.
- What's the recent tenant-quality profile in this submarket — average credit score on applications, eviction rate, late-payment / NSF rate, and stable-employment percentage? A property-management company in the area should have these aggregated.
- How much new for-sale + rental construction is in the pipeline within 1–3 miles? Heavy new supply typically softens prices + rents 12–24 months out; constrained supply supports both.
CashFlowRE · CFR-VRG8BP2FBVBZWX
· Data 2 days ago
cashflowre.app · 2026-05-29