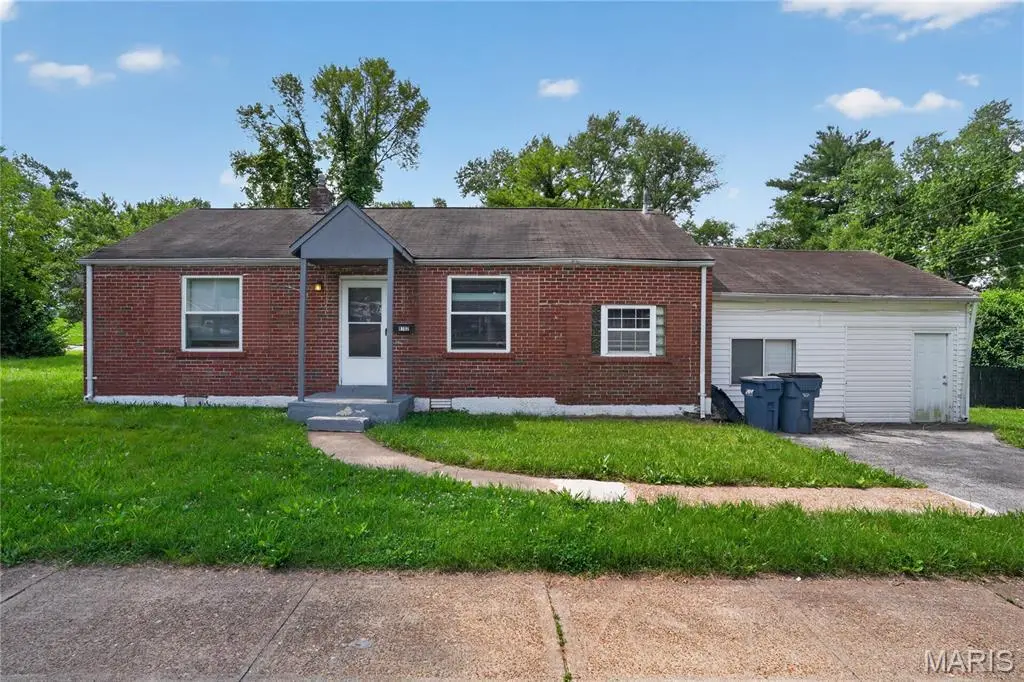
8102 Frost Ave · Berkeley, MO
Flood risk 1/10 · Minimal
- FEMA flood zone
- X (unshaded)
- Chance of flooding over 30 yrs
- 0.0%
- Est. flood insurance / yr
- $507 – $1,088
Fire risk 1/10 · Minimal
- Est. fire insurance / yr
- $1,054 – $1,958
Heat risk 4/10 · Minor
- Hot days now (above 106°F)
- 7 days/yr
- Hot days in 30 yrs
- 21 days/yr
Wind risk 2/10 · Minimal
- Chance of severe wind over 30 yrs
- 1.0%
Air-quality risk 3/10 · Minor
- Unhealthy air days now
- 3 days/yr
- Unhealthy air days in 30 yrs
- 5 days/yr
Risk factors via First Street. Map © Google.
Why this score? — see what drove the B grade
The composite is a weighted blend of 9 inputs, each scored 0–100. Each bar is that input's sub-score; the figure is the points it added to the 100-point composite (weight × sub-score).
- Cash flow +30.0/30.0
- ARV discount +15.0/15.0
- DSCR +10.0/10.0
- 1% rule +9.7/10.0
- Rent growth +2.9/5.0
- Livability +2.7/5.0
- Condition / age +2.5/5.0
- Schools +1.2/10.0
- Appreciation +0.0/10.0
$94,900
🖨 Deal sheet 📄 Offer letter ✓ Due diligence
Listing remarks
Charming and move-in ready 3-bedroom ranch home in Berkeley! This single-level brick house offers an ideal layout with all living spaces located on the main floor. The bright and spacious living room opens beautifully to a functional eat-in kitchen with built-in appliances. Updates include seamless laminate flooring throughout the primary areas. Positioned on a generous, level lot with a spacious backyard, complete with a functional storage shed and private driveway parking. Enjoy easy access to major highways, local parks, and city amenities.
Key facts
- Move-in ready
- Single-level
- Brick house
Tags
Property features AI
Finance
- Other: No pool; Lot frontage approximately 56 feet
- Financial info: Lease not considered
- HOA & community: No community features
Exterior
- Parking: Driveway and off-street parking
- Security: No security features provided
- Utilities: Public water; Public sewer; Electric: Other
- Home design: Single-family residence; One story; House structure
- Construction: Brick construction; Composition roof; Slab foundation; Built (year source: public records)
- Exterior features: Level lot
Interior
- Kitchen: No specific kitchen appliance details provided
- Bedrooms: 3 bedrooms (all on the main level)
- Flooring: No flooring details provided
- Bathrooms: 1 full bathroom (on the main level)
- Heating & cooling: Other heating; Central electric air conditioning
- Interior features: Appliances: Other; No basement
- Laundry & utility: No laundry details provided
Neighborhood map
What this means for you Summary
Snapshot
- This is a 3-bed/1.0-bath single-family listed at $95k.
Deal economics
- At list price, monthly cash flow is $508 ($6k/yr) — positive.
- The deal already cash-flows at list — no discount required.
- Meets the 1% rule at list price ($1k rent vs $95k).
- Cap rate 12.7% vs local median 10.1% in Berkeley — meaningfully above typical; check what's discounted (condition, days-on-market, listing class) to confirm the premium yield is real.
Location & tenants
- Location reads 54/100 on livability (#774 in MO) — a working-class tenant base; expect higher turnover. Strengths: cost of living A+, housing A; Watch: health & safety C-, crime F, amenities F.
- Ferguson-Florissant R-II (suburban): math 7% / reading 20% proficiency, ranked #311 of 324 in MO (top 96%) — low school quality limits family demand, transient renter base, plan for 1-2y turnover; 70% free/reduced lunch — lower-income household profile, screen leases tightly.
- Zoned schools: Berkeley Elementary School (math 4% / reading 13%, grade F, #1,050 of 1,115 statewide, top 94%, 346 students, 99% FRL); Mccluer High (math 0% / reading 17%, grade F, #511 of 521 statewide, top 98%, 1,181 students, 100% FRL) — zoned schools average 99% FRL vs 70% district-wide (30 pts higher); higher-poverty schools than district average — tighter screening recommended.
- Market conditions: Rents rising (+1.6%/yr); 70 active listings in the ZIP; 40 comparable units currently listed for rent nearby; rentals at typical pace (median 24d on market — plan ~3-4 weeks tenant-placement turnaround); lower-income renter base — watch delinquency; 920 units permitted in St. Louis County in 2024 (250 in 5+ unit buildings).
- This rent runs 37% of the median local income ($45k/yr) — at the standard rent-burdened threshold; future hikes will face affordability resistance.
Forward outlook
- Local home prices are declining (-3.0%/yr); year-one equity from $656 of loan paydown is wiped out by about $3k of value loss. Plan a longer hold.
- At projected returns (-3.0% appreciation + 1.6% rent growth), your $27k cash investment doubles in ~6 years — after that, you're playing with house money.
Negotiation context
- Only 14 days on market — expect competitive offers; lowballing is unlikely to land.
Risks & watch-outs
- Watch-outs: built in 1949 — expect roof / HVAC / electrical / plumbing capex.
Questions for the listing agent
- Built in 1949 — when were the roof, HVAC, electrical panel, plumbing, and water heater last replaced?
- Is there a deadline driving the sale (1031 exchange, divorce, estate, relocation)? That informs how much negotiation room exists.
- Schools are F-rated, which usually means shorter tenancies and higher turnover. Who's the typical renter profile here, and what's been the actual vacancy rate?
- Crime grade is F in this area — have there been break-ins, vandalism, or insurance claims at this property in the last 3 years? What carrier currently insures it and at what premium?
- What's the average days-on-market for RENTAL listings here right now (not sales)? A rising rental-DOM trend means longer vacancies and softer asking-rent achievability than the comps imply.
- What's the recent tenant-quality profile in this submarket — average credit score on applications, eviction rate, late-payment / NSF rate, and stable-employment percentage? A property-management company in the area should have these aggregated.
- How much new for-sale + rental construction is in the pipeline within 1–3 miles? Heavy new supply typically softens prices + rents 12–24 months out; constrained supply supports both.
Investment metrics
- 1% rule
- 1.47% ✓
- Cap rate
- 12.71%
- Cash-on-cash
- 22.93%
- DSCR
- 2.02
- GRM
- 5.7
CMA / ARV
- ARV (on-the-fly)
- $114,460
- Comps found
- 12
Show comp detail 12 sales within ~0.75 mi
| Address | Dist | Beds/Ba | Sqft | Sold | Price | $/sf | Match |
|---|---|---|---|---|---|---|---|
| 6801 Knoll Ave | 0.07mi | 3/1.0 | 1,224 (+4%) | 1mo | $104,900 | $86 | 90 |
| 8302 Woodhurst Dr | 0.29mi | 3/1.0 | 1,120 (-5%) | 1mo | $99,900 | $89 | 78 |
| 8301 Pepperidge Dr | 0.37mi | 3/1.0 | 1,120 (-5%) | 1mo | $139,900 | $125 | 73 |
| 258 Williams Blvd | 0.33mi | 3/1.0 | 1,075 (-9%) | 0mo | $129,900 | $121 | 69 |
| 8513 Midwood Ave | 0.59mi | 3/2.0 | 1,176 (-0%) | 0mo | $94,900 | $81 | 68 |
| 8219 Davenport Dr | 0.56mi | 3/1.0 | 1,116 (-5%) | 1mo | $115,000 | $103 | 64 |
| 6604 Graybirch Dr | 0.36mi | 3/2.0 | 1,288 (+9%) | 1mo | $124,900 | $97 | 63 |
| 211 Frost Ave | 0.44mi | 3/1.0 | 1,066 (-10%) | 2mo | $84,900 | $80 | 62 |
| 8418 Midwood Ave | 0.47mi | 3/2.0 | 1,288 (+9%) | 2mo | $125,000 | $97 | 58 |
| 8443 Red Fir Dr | 0.50mi | 3/2.0 | 1,288 (+9%) | 2mo | $32,000 | $25 | 56 |
| 8379 Midwood Ave | 0.44mi | 2/1.0 (-1) | 1,052 (-11%) | 2mo | $89,900 | $85 | 55 |
| 8406 January Ave | 0.57mi | 3/2.0 | 1,288 (+9%) | 2mo | $160,000 | $124 | 53 |
Match score weights: distance 35% · size 25% · config 20% · recency 20%. Top-matched comps best support the ARV.
Projected returns pro-forma
-3.0% appreciation · 1.61% rent growth · sell at horizon
- IRR
- 14.4%
- Equity multiple
- 1.57×
- Total profit
- $15,017
- Equity at exit
- $14,150
- IRR
- 22.1%
- Equity multiple
- 2.77×
- Total profit
- $46,965
- Equity at exit
- $8,205
Cash invested: $26,572 (down + closing). Projections, not guarantees.
Landlord ↔ Tenant lean methodology
- Overall (STATE)
- 81 Strongly Landlord-Friendly
- State Missouri
- 81 Strongly Landlord-Friendly · R+10
- County
- — inherits STATE
- City
- — inherits STATE
ZIP-level market 63134
- Rents YoY
- 1.6%
- Active inventory
- 70
- Price-to-rent
- 5.7×
Monthly cashflow live
- Estimated rent
- $1,396 high interval (Pro) →
- Mortgage (P&I)
- −$498
- Tax from tax record
- −$58 /mo · $694/yr
- Insurance
- −$40
- HOA
- −$0
- Vacancy / Maint / Mgmt
- −$293
- Net cashflow
- $508
Break-even live
UW: 25.0% down · 7.5% · 30yr · 1.5% tax · 5.0% vac · 8.0% maint · 8.0% mgmt
Financing live
Cash to close
- Down payment
- $23,725
- Closing costs
- $2,847
- Reserves months
- —
- Total cash needed
- —
Loan-product check · same deal, 3 products live
Conventional
25% down · 7.5% · 30yr
- Down + closing
- —
- Monthly P&I
- —
- Monthly cashflow
- —
- DSCR
- —
- Eligible?
- —
Personal DTI + credit; lowest rate.
DSCR
20% down · 8.5% · 30yr
- Down + closing
- —
- Monthly P&I
- —
- Monthly cashflow
- —
- DSCR
- —
- Eligible?
- —
No personal income docs; deal must DSCR.
Hard money
10% down · 12.0% · 12mo
- Down + closing
- —
- Monthly P&I
- —
- Monthly cashflow
- —
- DSCR
- —
- Eligible?
- —
Short-term bridge; refi at stabilization.
Rent comps 40 comps
| Address | Beds | Baths | Sqft | Rent | $/sqft | DOM | Units | Dist |
|---|---|---|---|---|---|---|---|---|
| 6867 Thurston Ave Saint Louis, MO | 3.0 | 2.0 | 1243 | $1,580 | $1.27 | 43d | 1 | 0.14mi |
| 6625 Thurston Ave Saint Louis, MO | 2.0 | 1.0 | 939 | $1,400 | $1.49 | 23d | 1 | 0.17mi |
| 6625 Thurston Ave Saint Louis, MO | 2.0 | 1.0 | 939 | $1,300 | $1.38 | 43d | 1 | 0.17mi |
| 153 Bascom Dr Saint Louis, MO | 3.0 | 1.0 | 1076 | $1,195 | $1.11 | 19d | 1 | 0.37mi |
| 541 Hentschel Pl Saint Louis, MO | 2.0 | 1.0 | 1305 | $1,500 | $1.15 | 4d | 1 | 0.38mi |
| 8330 Woodhurst Dr Saint Louis, MO | 3.0 | 1.0 | 1120 | $1,000 | $0.89 | 7d | 1 | 0.38mi |
| 171 Elbring Dr Saint Louis, MO | 3.0 | 1.5 | 1008 | $1,395 | $1.38 | 12d | 1 | 0.39mi |
| 24 Vierling Dr Saint Louis, MO | 2.0 | 1.0 | 850 | $1,290 | $1.52 | 7d | 1 | 0.39mi |
| 8418 Bayberry Dr Saint Louis, MO | 3.0 | 2.0 | 1288 | $1,350 | $1.05 | 21d | 1 | 0.42mi |
| 46 Bascom Dr Saint Louis, MO | 2.0 | 1.0 | 932 | $1,175 | $1.26 | 43d | 1 | 0.47mi |
| 260 Sadonia Ave Saint Louis, MO | 3.0 | 2.0 | 1088 | $1,623 | $1.49 | 20d | 1 | 0.49mi |
| 8412 Chalons Ct Saint Louis, MO | 3.0 | 1.0 | 1380 | $1,370 | $0.99 | 23d | 1 | 0.51mi |
| 263 Sadonia Ave Saint Louis, MO | 3.0 | 2.0 | 888 | $1,350 | $1.52 | 43d | 1 | 0.51mi |
| 6333 Peurifoy Ave Saint Louis, MO | 3.0 | 2.0 | 840 | $1,295 | $1.54 | 23d | 1 | 0.54mi |
| 107 Anistasia Dr Saint Louis, MO | 2.0 | 2.0 | 1030 | $1,400 | $1.36 | 23d | 1 | 0.54mi |
| 1275 N Florissant Rd Saint Louis, MO | 2.0 | 1.0 | 1008 | $1,275 | $1.26 | 23d | 1 | 0.56mi |
| 6452 Evergreen Blvd Saint Louis, MO | 3.0 | 2.0 | 1288 | $1,500 | $1.16 | 23d | 1 | 0.57mi |
| 8437 January Ave Saint Louis, MO | 3.0 | 2.0 | 1288 | $1,350 | $1.05 | 43d | 1 | 0.60mi |
| 7025 Richwood Ln Hazelwood, MO | 3.0 | 1.0 | 936 | $1,375 | $1.47 | 17d | 1 | 0.62mi |
| 6336 Washington Ave Berkeley, MO | 2.0 | 1.0 | 720 | $1,175 | $1.63 | 43d | 1 | 0.64mi |
| 6334 Washington Ave Berkeley, MO | 3.0 | 1.0 | 864 | $1,100 | $1.27 | 4d | 1 | 0.64mi |
| 11 Anistasia Dr Saint Louis, MO | 3.0 | 1.5 | 1120 | $1,345 | $1.20 | 23d | 1 | 0.64mi |
| 8439 Alder Ave Saint Louis, MO | 3.0 | 1.5 | 1176 | $1,425 | $1.21 | 23d | 1 | 0.65mi |
| 241 Flora Dr Saint Louis, MO | 2.0 | 1.0 | 703 | $1,075 | $1.53 | 23d | 1 | 0.65mi |
| 6315 Washington Ave Berkeley, MO | 2.0 | 1.0 | 739 | $1,175 | $1.59 | 16d | 1 | 0.69mi |
| 36 Connolly Dr Saint Louis, MO | 3.0 | 1.0 | 1024 | $1,149 | $1.12 | 23d | 1 | 0.71mi |
| 6132 Eaton Dr Saint Louis, MO | 2.0 | 1.0 | 792 | $1,125 | $1.42 | 23d | 1 | 0.76mi |
| 222 Henquin Dr Saint Louis, MO | 2.0 | 1.0 | 816 | $1,050 | $1.29 | 17d | 1 | 0.76mi |
| 6214 Jefferson Ave Saint Louis, MO | 2.0 | 1.0 | 816 | $1,195 | $1.46 | 23d | 1 | 0.77mi |
| 24 Barto Dr Saint Louis, MO | 3.0 | 1.0 | 864 | $1,400 | $1.62 | 43d | 1 | 0.77mi |
| 221 Barto Dr Saint Louis, MO | 3.0 | 2.0 | 958 | $1,295 | $1.35 | 20d | 1 | 0.80mi |
| 6156 Wulff Dr Saint Louis, MO | 3.0 | 2.0 | 960 | $1,425 | $1.48 | 10d | 1 | 0.80mi |
| 8306 Whitewater Dr Saint Louis, MO | 3.0 | 1.0 | 792 | $1,195 | $1.51 | 7d | 1 | 0.81mi |
| 220 Du Bourg Ln Florissant, MO | 2.0 | 1.0 | 816 | $1,150 | $1.41 | 43d | 1 | 0.81mi |
| 6044 Cascade Dr Saint Louis, MO | 2.0 | 1.0 | 984 | $1,150 | $1.17 | 7d | 1 | 0.83mi |
| 6698 Amora Ave Berkeley, MO | 2.0–3.0 | 1.5 | 1625 | $1,500 | $0.92 | 43d | 1 | 0.84mi |
| 6234 Hancock Ave Berkeley, MO | 2.0 | 1.0 | 846 | $1,050 | $1.24 | 43d | 1 | 0.86mi |
| 60 Mayme Dr Saint Louis, MO | 3.0 | 1.0 | 960 | $1,285 | $1.34 | 43d | 1 | 0.96mi |
| 910 Disco Dr Saint Louis, MO | 3.0 | 1.0 | 924 | $1,260 | $1.36 | 16d | 1 | 1.01mi |
| 5 Santa Cruz Dr Florissant, MO | 2.0 | 1.0 | 1410 | $1,411 | $1.00 | 16d | 1 | 1.04mi |
Listing history 11 events
-
2026-06-18days on market $94,900 Active 14 DOM
-
2026-06-17days on market $94,900 Active 13 DOM
-
2026-06-16days on market $94,900 Active 12 DOM
-
2026-06-15days on market $94,900 Active 11 DOM
-
2026-06-13days on market $94,900 Active 9 DOM
-
2026-06-13days on market $94,900 Active 8 DOM
-
2026-06-09days on market $94,900 Active 5 DOM
-
2026-06-08days on market $94,900 Active 4 DOM
-
2026-06-07days on market $94,900 Active 3 DOM
-
2026-06-05remarks 549-char remark
-
2026-06-05$94,900 Active 1 DOM
ⓘ Source: listings_history table (triggers on properties + properties_extension) + one-shot
backfill from property_details.listing_events for pre-trigger history.
Tax reassessment forecast MO · Resets to sale price
- Current annual tax
- $694 · $58/mo
- Projected year-2 tax
- $921 · $77/mo
- Expected delta
- +$226/yr (+$19/mo · 32.6%)
ⓘ Screening estimate from a state-policy table — verify with the county assessor before closing.
Climate risk First Street
- Flood 1/10 Low FEMA zone X (unshaded) · 0% chance over 30 yrs
- Wildfire 1/10 Low
- Heat 4/10 Moderate 7 d/yr ≥106°F today · 21 d/yr by 30 yrs out
- Wind 2/10 Low 100% chance of damaging wind over 30 yrs
- Air quality 3/10 Moderate 3 unhealthy d/yr today · 5 by 30 yrs out
Nearby sold comps map
Loading sold comps map…
Walkable amenities ~0.75 mi
Loading nearby amenities…
Taxation est. · year 1
- Rental income
- $16,751
- − Mortgage interest
- −$5,316
- − Property taxes
- −$694
- − Insurance
- −$474
- − Repairs & maintenance
- −$1,340
- − Management
- −$1,340
- − Depreciation
- −$2,761
- Taxable income
- $4,826
- Est. tax owed @ 24.0%
- −$1,158
- After-tax cash flow
- $4,934/yr
For passive investors: Depreciation is non-cash, so a rental often shows a tax loss while cash-flowing — sheltering income. Rental losses are passive: they offset passive income freely, and up to $25,000/yr can offset ordinary (W-2) income if you actively participate and your MAGI is under $100k (phasing out to $0 by $150k); unused losses carry forward. On sale, claimed depreciation is recaptured at up to 25%, and gains may owe capital-gains tax (a 1031 exchange can defer both). Figures are a year-1 estimate at your 24.0% rate — not tax advice; consult a CPA.
Schools (NCES district)
- District
- Ferguson-Florissant R-II
- NCES district ID
- 2912010
- Math proficiency
- 7% ▼ -9.00%
- Reading proficiency
- 20% ▼ -6.00%
- Median HH income
- $44,610
- Composite
- 11.96/100
- National rank
- #9666
- State rank
- #311 of 324 in MO
Livability — Berkeley
- Score
- 54/100
- State rank
- #774
- US rank
- #23800
Category grades
Schools grade is shown separately in the Schools card above.
Census & demographics
- Census place
- Berkeley, MO
- County
- Saint Louis County · 888,823 people
- City population
- 13,059
- Metro
- St. Louis, MO-IL
- Population (ZIP)
- 13,059
- Household income
- $44,680
- Rent vs Own
- Severe rent burden
- 655.0
Population outlook (St. Louis County) Hauer SSP2
- Today (2025)
- 1,025,227 people
- By 2030
- 1,028,023 · +0.3%
- By 2040
- 1,020,940 · -0.4%
- By 2050
- 1,007,280 · -1.8%
- By 2075
- 987,277 · -3.7%
- By 2100
- 921,984 · -10.1%
Race, ethnicity, and origin ACS 2023
- Neighborhood character
- Predominantly Black (66%)
- Race & ethnicity
- Black 66% White 17% Hispanic / Latino 13% Two or more races 7%
- Hispanic origin (detail)
- Mexican 8%
- Common ancestry
- Lithuanian 1%
- Foreign-born
- 6% · Canada
- Languages at home
- 86% English-only · Spanish 11%
Political lean MEDSL · St. Louis
- 2024 margin
- Strong D (+23.4) · D 60.8% · R 37.4% · Other 1.7%
- 2008→2024 swing
- +3.5pp toward D · 2008: 19.9pp · 2024: 23.4pp
- All cycles
- 2024: D+23.4 2020: D+24.0 2016: D+16.2 2012: D+13.7 2008: D+19.9
Not yet ingested
- Civics
- —
Market trends
- HPI YoY
- ▼ -164.02%
- Current HPI
- 226.9524
- Rent YoY
- ▲ 1.61%
- Metro
- St. Louis, MO-IL
- State GDP YoY
- ▲ 1.84%
- F500 in state
- 20
Industry mix (Fortune 500 HQ in MO)
| Industry | F500 HQs | Revenue |
|---|---|---|
| Healthcare | 1 | $163B |
|
||
| Insurance | 1 | $21B |
|
||
| Industrial Technology | 1 | $17B |
|
||
| Retail | 1 | $16B |
|
||
| Industrial Distribution | 1 | $10B |
|
||
| Utilities | 1 | $9B |
|
||
Price history
-81.9% since first listed7 events — show timeline
- 2026-06-04 Listed $94,900 MARIS as Distributed by MLS Grid
- 2021-05-24 Sold (Public Records) $2,419,949 Public Records
- 2018-03-13 Sold (Public Records) $1,172,631 Public Records
- 2017-09-05 Price Changed $59,000 MARIS as Distributed by MLS Grid
- 2013-12-18 Sold (Public Records) $640,000 Public Records
- 2009-12-30 Sold (Public Records) $524,000 Public Records
- 1995-03-16 Sold (Public Records) — Public Records
Property tax history
+0.7%/yrLatest (2022): $694 · +0.6% YoY. Source: county tax records.
Cash-flow waterfall
monthlySold comps — $/sqft
last 12 mo · ≤1 miLoading sold comps…