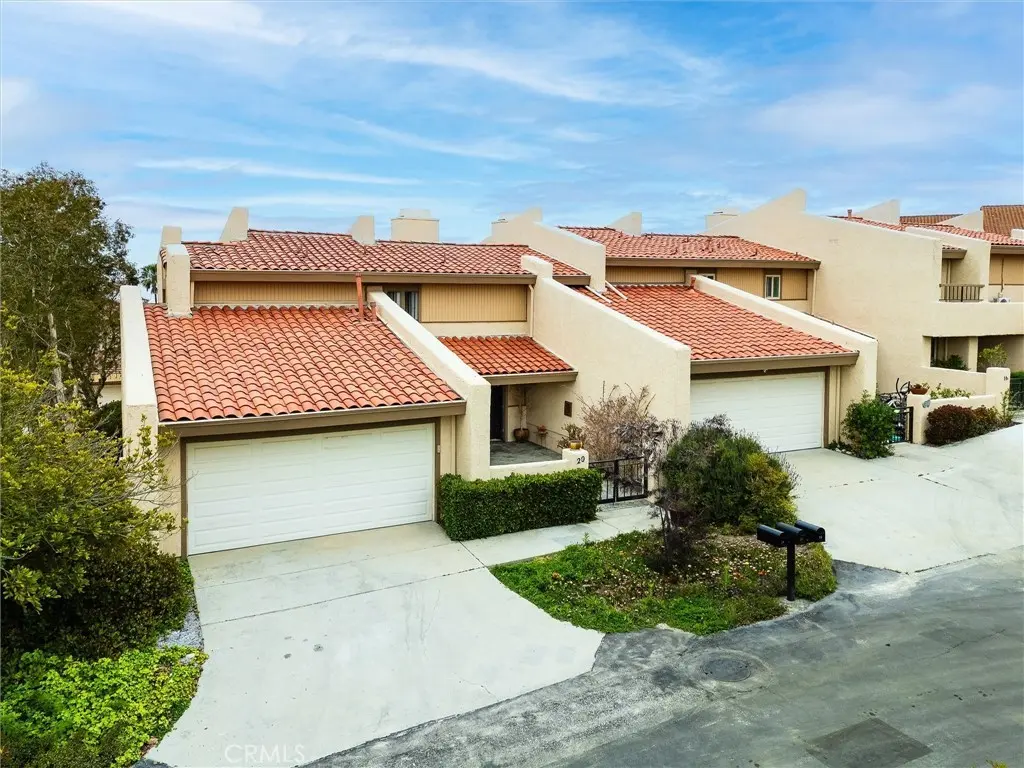
20 Peartree Ln #25
Rolling Hills Estates, CA 90274
$998,000D
3 bd · 3.0 ba ·
2,028 sqft ·
Built 1978
· Condo
· Active
· 101 DOM
Cashflow @ list (25.0% down · 7.5%)
Estimated rent
$5,884/mo
Mortgage (P&I)
−$5,234
Tax + insurance
−$777
HOA
−$727
Vac / Maint / Mgmt
−$1,236
Net cashflow
$-2,089/mo
Annual
$-25,068/yr
Cap rate
3.78%
Cash-on-cash
-8.97%
DSCR
0.60
1% rule
0.59%
Cash to close
$279,440
Investor read
- This is a 3-bed/3.0-bath condo listed at $998k.
- At list price, monthly cash flow is $-2k ($-25k/yr) — negative.
- To cash-flow at today's rent, offer at most $629k (37.0% below list).
- To meet the 1% rule (rent ≥ 1% of price), the offer needs to be $588k (41.0% below list).
- It's been on market 101 days — a 9% lower offer ($908k) is reasonable based on typical stale-listing flexibility.
- Recommended offer: $588k (41.0% below list) — sets the bar for 1% rule.
- In year one you build about $7k of equity ($7k loan paydown + $511 appreciation (0.1% local appreciation)).
- Location reads 75/100 on livability (#122 in CA, #4,273 nationally) — a middle-class / working-renter tenant base. Strengths: employment A+, crime A, commute A-; Watch: cost of living F, health & safety F.
- Palos Verdes Peninsula Unified (suburban): math 72% / reading 76% proficiency, ranked #51 of 1,400 in CA (top 4%) — strong family-tenant draw, lease renewals of 3-5y typical; only 3% free/reduced lunch — higher-income household profile.
- Zoned schools: Cornerstone At Pedregal Elementary (433 students, 6% FRL); Ridgecrest Intermediate (890 students, 10% FRL); Palos Verdes Peninsula High (2,290 students, 9% FRL).
- Market conditions: Rents rising (+1.8%/yr); 130 active listings in the ZIP; 17 comparable units currently listed for rent nearby; rentals at typical pace (median 24d on market — plan ~3-4 weeks tenant-placement turnaround); high-income renter base; 19,697 units permitted in Los Angeles County in 2024 (9,426 in 5+ unit buildings).
- Los Angeles County population projected at +9% by 2050 — modest demand growth; plan on rents tracking national, not racing it.
- By year 7, paydown + projected appreciation supports a ~$64k cash-out refi (75% LTV) — recoverable capital for the next deal without selling this one.
- Climate carrying-cost: moderate wildfire risk — expect insurance premiums to compound above CPI over the hold.
- Cap rate 3.8% vs local median 1.8% in Rolling Hills Estates — top-decile yield for the area; either an underpriced asset or a hidden risk that comps aren't pricing in. Stress-test before assuming the spread holds.
- This rent runs 33% of the median local income ($216k/yr) — at the standard rent-burdened threshold; future hikes will face affordability resistance.
Questions for listing agent
- What do current leases actually rent for vs. the listed asking? Can we see a recent rent roll and the last 12 months of T-12 income?
- It's been on market 101 days. Have you received any prior offers? Is the seller open to a 41% concession, seller financing, or rate buy-down credit?
- Built in 1978 — when were the roof, HVAC, electrical panel, plumbing, and water heater last replaced?
- What does the HOA fee cover, when was the last increase, and are there any pending special assessments or reserve-fund shortfalls?
- Any open or pending special assessments — roof, HVAC, plumbing, elevator, façade? What's the per-unit balance and payoff schedule, and is the seller paying it off at close or rolling it to the buyer?
- Why hasn't it sold? Are there any deal-killer items the seller is aware of (foundation, flood, title, zoning, code violations)?
- Is there a deadline driving the sale (1031 exchange, divorce, estate, relocation)? That informs how much negotiation room exists.
- Schools are A-rated — typically a magnet for longer-tenancy family renters. What's the average tenant stay here, and is there a school-zone premium baked into asking?
CashFlowRE · CFR-VTVR8N4GVNDZP1
· Data 1 day ago
cashflowre.app · 2026-05-29