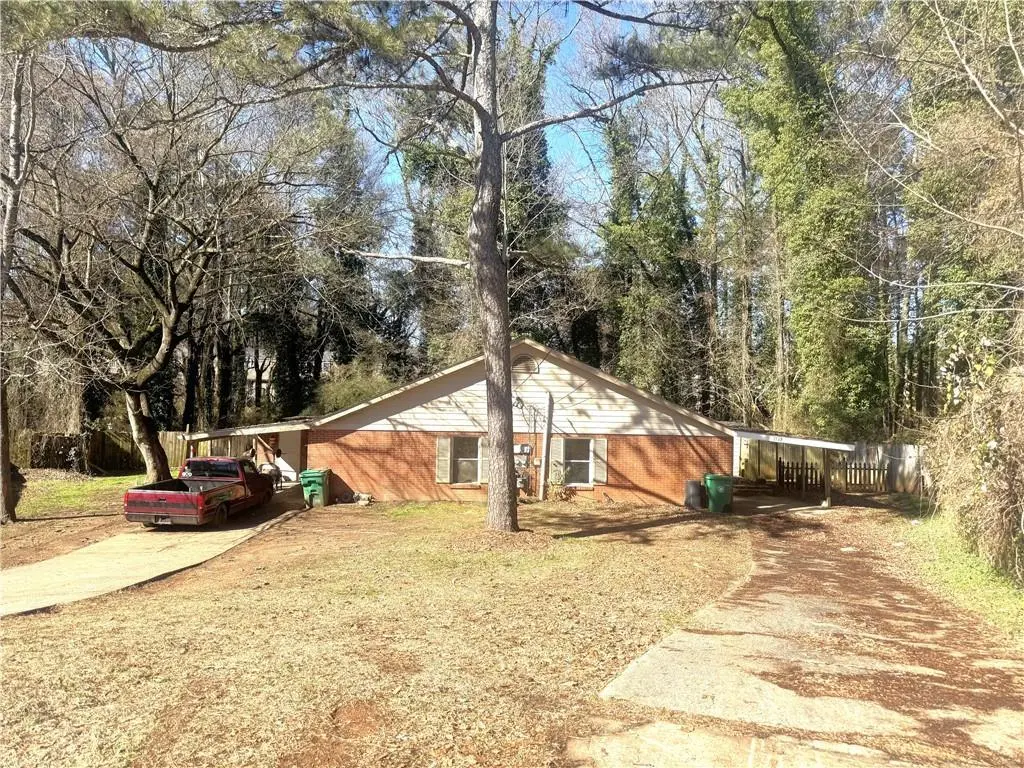
2126 Hanfred Ct
Tucker, GA 30084
$380,000D-
4 bd · 2.0 ba ·
1,680 sqft ·
Built 1964
· MultiFamily
· Active
· 120 DOM
Cashflow @ list (25.0% down · 7.5%)
Estimated rent
$3,290/mo
Mortgage (P&I)
−$1,993
Tax + insurance
−$693
HOA
−$0
Vac / Maint / Mgmt
−$691
Net cashflow
$-87/mo
Annual
$-1,042/yr
Cap rate
6.02%
Cash-on-cash
-0.98%
DSCR
0.96
1% rule
0.87%
Cash to close
$106,400
Investor read
- This is a 2 × 2-bed/1.0-bath units multifamily listed at $380k.
- At list price, monthly cash flow is $-87 ($-1k/yr) — negative. Per door: $-43/mo.
- To cash-flow at today's rent, offer at most $365k (4.0% below list).
- To meet the 1% rule (rent ≥ 1% of price), the offer needs to be $329k (13.4% below list).
- It's been on market 120 days — a 9% lower offer ($346k) is reasonable based on typical stale-listing flexibility.
- Recommended offer: $329k (13.4% below list) — sets the bar for 1% rule.
- Local home prices are declining (-3.0%/yr); year-one equity from $3k of loan paydown is wiped out by about $11k of value loss. Plan a longer hold.
- Location reads: area grade D — affects rentability + tenant quality, not the cash-flow math above.
- Dekalb County (suburban): math 19% / reading 28% proficiency, ranked #125 of 174 in GA (top 72%) — low school quality limits family demand, transient renter base, plan for 1-2y turnover; 68% free/reduced lunch — lower-income household profile, screen leases tightly.
- Market conditions: Rents soft (-0.8%/yr); 216 active listings in the ZIP; 16 comparable units currently listed for rent nearby; rentals lingering (median 44d on market — plan ~5-8 weeks vacancy on turnover, expect pricing pressure); 50% of comp listings sitting > 30 days — soft ceiling on asking rent; solid renter incomes; 1,240 units permitted in DeKalb County in 2024 (385 in 5+ unit buildings).
- DeKalb County population projected at +28% by 2050 — long-run rental-demand tailwind backs the buy-and-hold thesis.
- Current owner paid $65k; list at $380k implies a 485% gain — meaningful room to come down on a strong offer.
- Climate carrying-cost: extreme-heat days projected 7→18/yr by 2055 (HVAC capex compounding) — expect insurance premiums to compound above CPI over the hold.
- Cap rate 6.0% vs local median 3.4% in Tucker — top-decile yield for the area; either an underpriced asset or a hidden risk that comps aren't pricing in. Stress-test before assuming the spread holds.
- At $3,290/mo this rent would consume 49% of the median local household income ($81k/yr) (locally 1743% of renters already pay >50% of income on rent) — very limited rent-growth headroom before tenants either downsize or default.
Questions for listing agent
- What do current leases actually rent for vs. the listed asking? Can we see a recent rent roll and the last 12 months of T-12 income?
- It's been on market 120 days. Have you received any prior offers? Is the seller open to a 13% concession, seller financing, or rate buy-down credit?
- Can we see the unit-by-unit rent roll, current vacancy, and any below-market leases? What's the average tenancy length?
- What capital expenditures (roof, boiler, parking lot, exteriors) have been made in the last 5 years, and what's planned in the next 2?
- Built in 1964 — when were the roof, HVAC, electrical panel, plumbing, and water heater last replaced?
- Why hasn't it sold? Are there any deal-killer items the seller is aware of (foundation, flood, title, zoning, code violations)?
- Is there a deadline driving the sale (1031 exchange, divorce, estate, relocation)? That informs how much negotiation room exists.
- The area grade is low — what's the realistic commute time and amenity access for the typical tenant pool here? Any planned neighborhood developments (good or bad) we should know about?
CashFlowRE · CFR-VV2P2M2F3MAZ8D
· Data 2 days ago
cashflowre.app · 2026-05-29