 Duplex
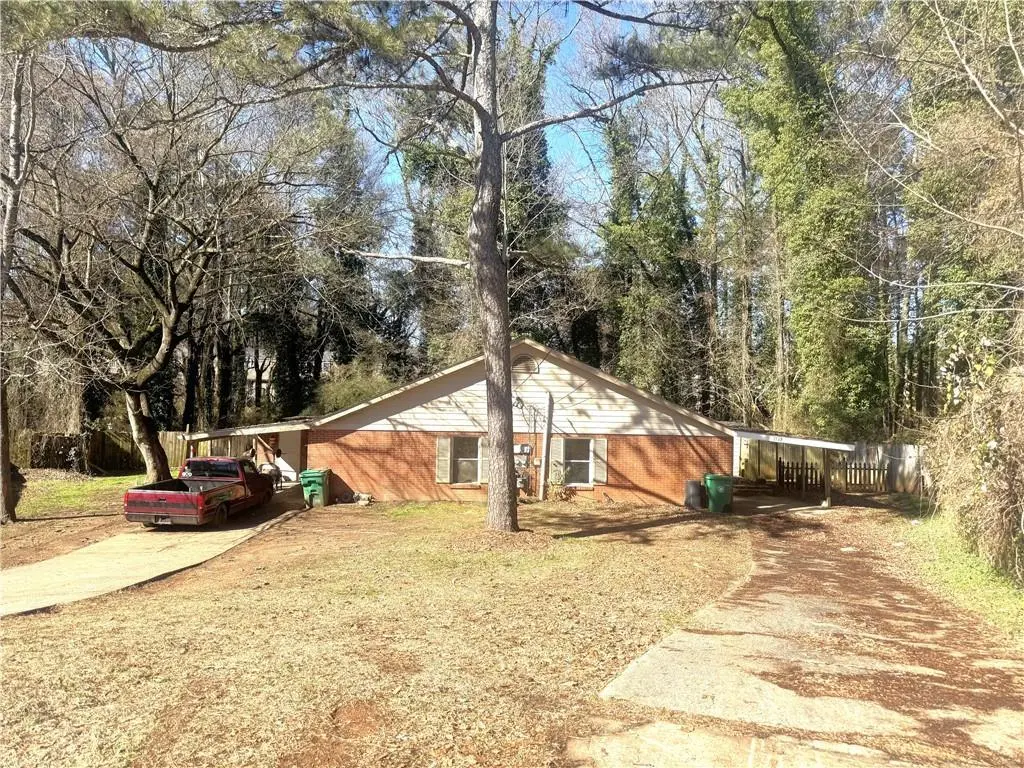
2126 Hanfred Ct · Tucker, GA
Flood risk 1/10 · Minimal
- FEMA flood zone
- X (unshaded)
- Chance of flooding over 30 yrs
- 0.0%
- Est. flood insurance / yr
- $507 – $1,088
Fire risk 3/10 · Minor
- Est. fire insurance / yr
- $963 – $1,789
Heat risk 5/10 · Moderate
- Hot days now (above 103°F)
- 7 days/yr
- Hot days in 30 yrs
- 18 days/yr
Wind risk 4/10 · Minor
- Chance of severe wind over 30 yrs
- 18.0%
Air-quality risk 6/10 · Moderate
- Unhealthy air days now
- 8 days/yr
- Unhealthy air days in 30 yrs
- 11 days/yr
Risk factors via First Street. Map © Google.
Why this score? — see what drove the D- grade
The composite is a weighted blend of 9 inputs, each scored 0–100. Each bar is that input's sub-score; the figure is the points it added to the 100-point composite (weight × sub-score).
- Cash flow +12.1/30.0
- ARV discount +7.5/15.0
- 1% rule +3.7/10.0
- DSCR +3.6/10.0
- Livability +2.5/5.0
- Condition / age +2.5/5.0
- Rent growth +2.3/5.0
- Schools +2.1/10.0
- Appreciation +0.0/10.0
$380,000
🖨 Deal sheet 📄 Offer letter ✓ Due diligence
Multi-family units
County records classify this as Multi-Family (2-4 Unit). Listing-text estimate: 2 units. confirmed
Listing remarks MLS
INVESTMENT OPPORTUNITY! OCCUPY ONE UNIT AND RENT THE OTHER. Highly demanded and easy to rent. Duplex located in Tucker, near Norcross, Doraville and Atlanta. Each unit has 2 bedrooms and 1 full bath (840 sqft). 2128 is leased for $1300 per month. Cul-de-sac and long driveway for multiple vehicle parking. Lot 0.86 acre. Prime location close to highway 141 and I-285, Lawrenceville Highway, MARTA stations, etc. Don't miss out on this AMAZING OPPORTUNITY! No HOA. No seller's disclosure as Seller never occupied the property. As-is. Seller owns multiple duplexes off the same street and plans to sell several. It is a MUST SEE!
Key facts
- Lot 0.86 acre
- Long driveway
- Cul-de-sac
Tags
Neighborhood map
What this means for you Summary
Snapshot
- This is a 2 × 2-bed/1.0-bath units multifamily listed at $380k.
Deal economics
- At list price, monthly cash flow is $-87 ($-1k/yr) — negative. Per door: $-43/mo.
- To cash-flow at today's rent, offer at most $365k (4.0% below list).
- To meet the 1% rule (rent ≥ 1% of price), the offer needs to be $329k (13.4% below list).
- Recommended offer: $329k (13.4% below list) — sets the bar for 1% rule.
- Cap rate 6.0% vs local median 3.4% in Tucker — top-decile yield for the area; either an underpriced asset or a hidden risk that comps aren't pricing in. Stress-test before assuming the spread holds.
Location & tenants
- Location reads: area grade D — affects rentability + tenant quality, not the cash-flow math above.
- Dekalb County (suburban): math 19% / reading 28% proficiency, ranked #125 of 174 in GA (top 72%) — low school quality limits family demand, transient renter base, plan for 1-2y turnover; 68% free/reduced lunch — lower-income household profile, screen leases tightly.
- Market conditions: Rents soft (-0.8%/yr); 216 active listings in the ZIP; 16 comparable units currently listed for rent nearby; rentals lingering (median 44d on market — plan ~5-8 weeks vacancy on turnover, expect pricing pressure); 50% of comp listings sitting > 30 days — soft ceiling on asking rent; solid renter incomes; 1,240 units permitted in DeKalb County in 2024 (385 in 5+ unit buildings).
- At $3,290/mo this rent would consume 49% of the median local household income ($81k/yr) (locally 1743% of renters already pay >50% of income on rent) — very limited rent-growth headroom before tenants either downsize or default.
Forward outlook
- Local home prices are declining (-3.0%/yr); year-one equity from $3k of loan paydown is wiped out by about $11k of value loss. Plan a longer hold.
- DeKalb County population projected at +28% by 2050 — long-run rental-demand tailwind backs the buy-and-hold thesis.
Negotiation context
- It's been on market 120 days — a 9% lower offer ($346k) is reasonable based on typical stale-listing flexibility.
- Current owner paid $65k; list at $380k implies a 485% gain — meaningful room to come down on a strong offer.
Risks & watch-outs
- Climate carrying-cost: extreme-heat days projected 7→18/yr by 2055 (HVAC capex compounding) — expect insurance premiums to compound above CPI over the hold.
Questions for the listing agent
- What do current leases actually rent for vs. the listed asking? Can we see a recent rent roll and the last 12 months of T-12 income?
- It's been on market 120 days. Have you received any prior offers? Is the seller open to a 13% concession, seller financing, or rate buy-down credit?
- Can we see the unit-by-unit rent roll, current vacancy, and any below-market leases? What's the average tenancy length?
- What capital expenditures (roof, boiler, parking lot, exteriors) have been made in the last 5 years, and what's planned in the next 2?
- Built in 1964 — when were the roof, HVAC, electrical panel, plumbing, and water heater last replaced?
- Why hasn't it sold? Are there any deal-killer items the seller is aware of (foundation, flood, title, zoning, code violations)?
- Is there a deadline driving the sale (1031 exchange, divorce, estate, relocation)? That informs how much negotiation room exists.
- The area grade is low — what's the realistic commute time and amenity access for the typical tenant pool here? Any planned neighborhood developments (good or bad) we should know about?
- What's the average days-on-market for RENTAL listings here right now (not sales)? A rising rental-DOM trend means longer vacancies and softer asking-rent achievability than the comps imply.
- What's the recent tenant-quality profile in this submarket — average credit score on applications, eviction rate, late-payment / NSF rate, and stable-employment percentage? A property-management company in the area should have these aggregated.
- How much new apartment / multifamily construction is in the pipeline within 1–3 miles? Heavy new supply (>2% of stock underway) typically softens rents 12–24 months out; light construction supports rent growth.
Investment metrics
- 1% rule
- 0.87% ✗
- Cap rate
- 6.02%
- Cash-on-cash
- -0.98%
- DSCR
- 0.96
- GRM
- 9.6
CMA / ARV
No comps found within radius.
Projected returns pro-forma
-3.0% appreciation · 0.0% rent growth · sell at horizon
- IRR
- -21.4%
- Equity multiple
- 0.28×
- Total profit
- $-76,663
- Equity at exit
- $56,659
- IRR
- -24.5%
- Equity multiple
- -0.04×
- Total profit
- $-110,790
- Equity at exit
- $32,855
Cash invested: $106,400 (down + closing). Projections, not guarantees.
Landlord ↔ Tenant lean methodology
- Overall (STATE)
- 90 Strongly Landlord-Friendly
- State Georgia
- 90 Strongly Landlord-Friendly · R+3
- County
- — inherits STATE
- City
- — inherits STATE
ZIP-level market 30084
- Rents YoY
- -0.8%
- Active inventory
- 216
- Price-to-rent
- 19.3×
Monthly cashflow live
- Estimated rent
- $3,290 high interval (Pro) →
- Mortgage (P&I)
- −$1,993
- Tax from tax record
- −$535 /mo · $6,418/yr
- Insurance
- −$158
- HOA
- −$0
- Vacancy / Maint / Mgmt
- −$691
- Net cashflow
- $-87
Break-even live
2-unit breakdown (identical units grouped — click to expand)
| Units | Beds | Baths | Est. rent |
|---|---|---|---|
| 2× units | 2 | 1 | $3,290 |
| #1 | 2 | 1 | $1,645 |
| #2 | 2 | 1 | $1,645 |
| Total (2 units) | $3,290 | ||
UW: 25.0% down · 7.5% · 30yr · 1.5% tax · 5.0% vac · 8.0% maint · 8.0% mgmt
Financing live
Cash to close
- Down payment
- $95,000
- Closing costs
- $11,400
- Reserves months
- —
- Total cash needed
- —
Loan-product check · same deal, 3 products live
Conventional
25% down · 7.5% · 30yr
- Down + closing
- —
- Monthly P&I
- —
- Monthly cashflow
- —
- DSCR
- —
- Eligible?
- —
Personal DTI + credit; lowest rate.
DSCR
20% down · 8.5% · 30yr
- Down + closing
- —
- Monthly P&I
- —
- Monthly cashflow
- —
- DSCR
- —
- Eligible?
- —
No personal income docs; deal must DSCR.
Hard money
10% down · 12.0% · 12mo
- Down + closing
- —
- Monthly P&I
- —
- Monthly cashflow
- —
- DSCR
- —
- Eligible?
- —
Short-term bridge; refi at stabilization.
Rent comps 16 comps
| Address | Beds | Baths | Sqft | Rent | $/sqft | DOM | Units | Dist |
|---|---|---|---|---|---|---|---|---|
| 2105 Fellowship Rd Tucker, GA | 4.0 | 2.0 | 1051 | $2,399 | $2.28 | 43d | 1 | 0.30mi |
| 1839 Fellowship Rd Tucker, GA | 2.0–3.0 | 1.0–2.0 | 1028 | $1,983 | $1.93 | 2d | 5 | 0.44mi |
| 4190 Smithfield Dr Tucker, GA | 3.0 | 2.0 | 1460 | $2,475 | $1.70 | 2d | 1 | 0.48mi |
| 2067 Brockett Rd Tucker, GA | 4.0 | 2.0 | 1795 | $2,495 | $1.39 | 43d | 1 | 0.70mi |
| 2462 Lehaven Dr Tucker, GA | 3.0 | 2.5 | 1778 | $2,095 | $1.18 | 43d | 1 | 0.77mi |
| 2449 Ivey Crest Cir Tucker, GA | 3.0 | 2.5 | 1858 | $2,300 | $1.24 | 1d | 1 | 0.77mi |
| 4407 Idlewood Ln Tucker, GA | 3.0 | 2.5 | 1300 | $1,700 | $1.31 | 18d | 1 | 0.80mi |
| 4309 Lehaven Cir Tucker, GA | 3.0 | 2.5 | 1540 | $1,750 | $1.14 | 1d | 1 | 0.90mi |
| 4781 Lavista Rd Tucker, GA | 4.0 | 2.0 | 1704 | $2,800 | $1.64 | 43d | 1 | 0.93mi |
| 2297 Hylaea Rd Tucker, GA | 3.0 | 2.0 | 1584 | $2,350 | $1.48 | 43d | 1 | 1.08mi |
| 1662 Idlewood Rd Tucker, GA | 3.0 | 3.0 | 1295 | $2,295 | $1.77 | 3d | 1 | 1.09mi |
| 1662 Idlewood Rd Unit 1 Tucker, GA | 3.0 | 3.0 | 1295 | $2,245 | $1.73 | 3d | 1 | 1.10mi |
| 4168 Deland Rd Tucker, GA | 3.0 | 2.0 | 1550 | $2,409 | $1.55 | 24d | 1 | 1.12mi |
| 4669 Lawrenceville Hwy Tucker, GA | 3.0 | 1.0 | 1500 | $2,100 | $1.40 | 43d | 1 | 1.33mi |
| 4064 Cedar Knoll Dr Tucker, GA | 3.0 | 2.0 | 1480 | $2,650 | $1.79 | 43d | 1 | 1.36mi |
| 1740 Samaria Trl Tucker, GA | 3.0 | 2.0 | 1774 | $2,200 | $1.24 | 43d | 1 | 1.49mi |
Listing history 15 events
-
2026-06-18days on market $380,000 Active 120 DOM
-
2026-06-17days on market $380,000 Active 119 DOM
-
2026-06-16days on market $380,000 Active 118 DOM
-
2026-06-15days on market $380,000 Active 117 DOM
-
2026-06-13days on market $380,000 Active 115 DOM
-
2026-06-09days on market $380,000 Active 111 DOM
-
2026-06-08days on market $380,000 Active 110 DOM
-
2026-06-07days on market $380,000 Active 109 DOM
-
2026-06-04days on market $380,000 Active 106 DOM
-
2026-06-03days on market $380,000 Active 105 DOM
-
2026-06-02days on market $380,000 Active 104 DOM
-
2026-06-01days on market $380,000 Active 103 DOM
-
2026-05-31days on market $380,000 Active 102 DOM
-
2026-02-18$380,000 Active 627-char remark
Show marketing remark (627 chars)
INVESTMENT OPPORTUNITY! OCCUPY ONE UNIT AND RENT THE OTHER. Highly demanded and easy to rent. Duplex located in Tucker, near Norcross, Doraville and Atlanta. Each unit has 2 bedrooms and 1 full bath (840 sqft). 2128 is leased for $1300 per month. Cul-de-sac and long driveway for multiple vehicle parking. Lot 0.86 acre. Prime location close to highway 141 and I-285, Lawrenceville Highway, MARTA stations, etc. Don't miss out on this AMAZING OPPORTUNITY! No HOA. No seller's disclosure as Seller never occupied the property. As-is. Seller owns multiple duplexes off the same street and plans to sell several. It is a MUST SEE!
-
1994-05-02soldstatus $65,000
ⓘ Source: listings_history table (triggers on properties + properties_extension) + one-shot
backfill from property_details.listing_events for pre-trigger history.
Tax reassessment forecast GA · Resets to sale price
- Current annual tax
- $6,418 · $535/mo
- Projected year-2 tax
- $6,418 · $535/mo
- Expected delta
- $0/yr ($0/mo · 0.0%)
ⓘ Screening estimate from a state-policy table — verify with the county assessor before closing.
Climate risk First Street
- Flood 1/10 Low FEMA zone X (unshaded) · 0% chance over 30 yrs
- Wildfire 3/10 Moderate
- Heat 5/10 Major 7 d/yr ≥103°F today · 18 d/yr by 30 yrs out
- Wind 4/10 Moderate 18% chance of damaging wind over 30 yrs
- Air quality 6/10 Major 8 unhealthy d/yr today · 11 by 30 yrs out
Nearby sold comps map
Loading sold comps map…
Walkable amenities ~0.75 mi
Loading nearby amenities…
Taxation est. · year 1
- Rental income
- $39,480
- − Mortgage interest
- −$21,286
- − Property taxes
- −$6,418
- − Insurance
- −$1,900
- − Repairs & maintenance
- −$3,158
- − Management
- −$3,158
- − Depreciation
- −$11,055
- Taxable loss
- −$7,496
- Est. tax savings @ 24.0%
- +$1,799
- After-tax cash flow
- $757/yr
For passive investors: Depreciation is non-cash, so a rental often shows a tax loss while cash-flowing — sheltering income. Rental losses are passive: they offset passive income freely, and up to $25,000/yr can offset ordinary (W-2) income if you actively participate and your MAGI is under $100k (phasing out to $0 by $150k); unused losses carry forward. On sale, claimed depreciation is recaptured at up to 25%, and gains may owe capital-gains tax (a 1031 exchange can defer both). Figures are a year-1 estimate at your 24.0% rate — not tax advice; consult a CPA.
Schools (NCES district)
- District
- Dekalb County
- NCES district ID
- 1301740
- Math proficiency
- 19% ▼ -12.00%
- Reading proficiency
- 28% ▼ -7.00%
- Median HH income
- $51,448
- Composite
- 20.92/100
- National rank
- #8482
- State rank
- #125 of 174 in GA
Livability — Tucker
No livability data for this city. (Only ~50 U.S. cities are tracked.)
Census & demographics
- Census place
- Tucker, GA
- County
- Dekalb County · 782,738 people
- City population
- 38,242
- Metro
- Atlanta-Sandy Springs-Alpharetta, GA
- Population (ZIP)
- 38,242
- Household income
- $81,304
- Rent vs Own
- Severe rent burden
- 1743.0
Population outlook (DeKalb County) Hauer SSP2
- Today (2025)
- 839,977 people
- By 2030
- 891,768 · +6.2%
- By 2040
- 988,894 · +17.7%
- By 2050
- 1,074,583 · +27.9%
- By 2075
- 1,245,026 · +48.2%
- By 2100
- 1,303,135 · +55.1%
Race, ethnicity, and origin ACS 2023
- Neighborhood character
- Highly diverse neighborhood (Simpson 0.75)
- Race & ethnicity
- White 33% Black 26% Hispanic / Latino 22% Asian 15% Two or more races 10%
- Hispanic origin (detail)
- Mexican 8% Puerto Rican 1% Dominican 2%
- Common ancestry
- Italian 3% Slovak 2% Serbian 2%
- Foreign-born
- 32% · Canada, Philippines, China
- Languages at home
- 61% English-only · Spanish 18% Other Indo-European 6% Vietnamese 3%
Political lean MEDSL · DeKalb
- 2024 margin
- Solid D (+64.8) · D 81.9% · R 17.1% · Other 1.0%
- 2008→2024 swing
- +6.1pp toward D · 2008: 58.6pp · 2024: 64.8pp
- All cycles
- 2024: D+64.8 2020: D+67.4 2016: D+64.8 2012: D+56.8 2008: D+58.6
Not yet ingested
- Civics
- —
Market trends
- HPI YoY
- ▼ -271.15%
- Current HPI
- 254.5784
- Rent YoY
- ▼ -0.80%
- Metro
- Atlanta-Sandy Springs-Alpharetta, GA
- State GDP YoY
- ▲ 2.66%
- F500 in state
- 28
Industry mix (Fortune 500 HQ in GA)
| Industry | F500 HQs | Revenue |
|---|---|---|
| Paper / Packaging | 2 | $29B |
|
||
| Retail | 1 | $160B |
|
||
| Transportation / Logistics | 1 | $91B |
|
||
| Airlines | 1 | $62B |
|
||
| Consumer Goods | 1 | $47B |
|
||
| Utilities | 1 | $25B |
|
||
Price history
+484.6% since first listed2 events — show timeline
- 2026-02-18 Listed $380,000 FMLS
- 1994-05-02 Sold (Public Records) $65,000 Public Records
Property tax history
+4.8%/yrLatest (2025): $6,418 · -10.1% YoY. Source: county tax records.
Cash-flow waterfall
monthlySold comps — $/sqft
last 12 mo · ≤1 miLoading sold comps…