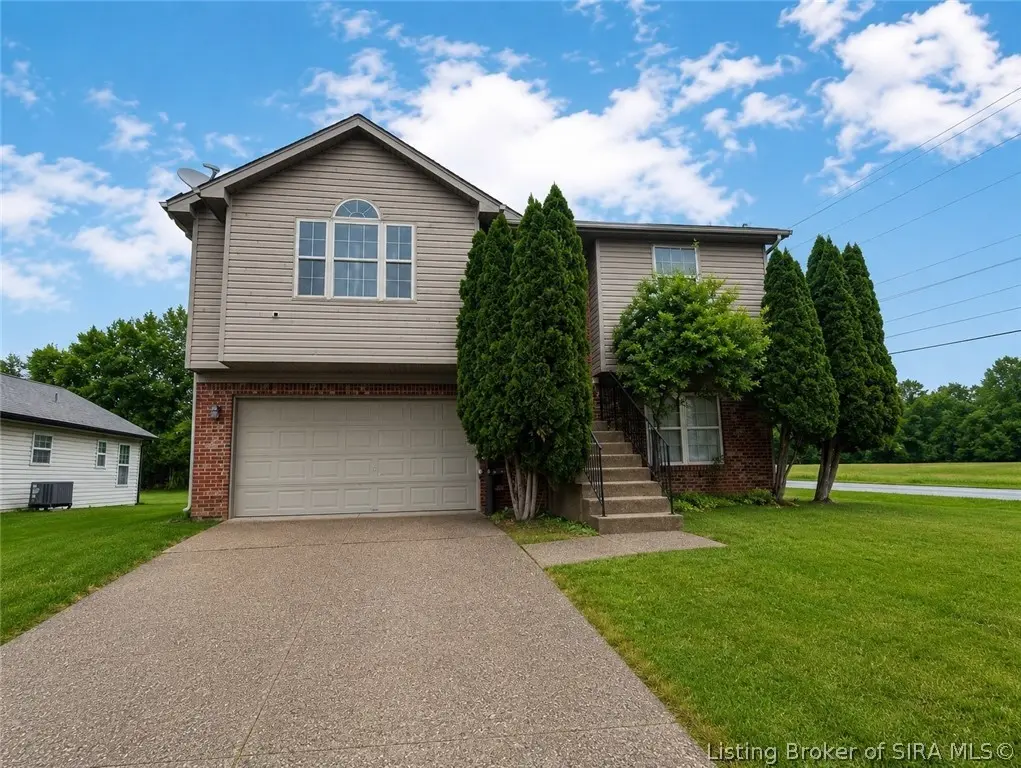
7501 Blue Sky Dr
Clarksville, IN 47172
$259,900D-
3 bd · 2.0 ba ·
1,717 sqft ·
Built 2003
· SingleFamily
· Active
· 44 DOM
Cashflow @ list (25.0% down · 7.5%)
Estimated rent
$1,540/mo
Mortgage (P&I)
−$1,363
Tax + insurance
−$332
HOA
−$0
Vac / Maint / Mgmt
−$323
Net cashflow
$-479/mo
Annual
$-5,750/yr
Cap rate
4.08%
Cash-on-cash
-7.90%
DSCR
0.65
1% rule
0.59%
Cash to close
$72,772
Investor read
- This is a 3-bed/2.0-bath single-family listed at $260k.
- At list price, monthly cash flow is $-479 ($-6k/yr) — negative.
- To cash-flow at today's rent, offer at most $175k (32.6% below list).
- To meet the 1% rule (rent ≥ 1% of price), the offer needs to be $154k (40.8% below list).
- It's been on market 44 days — a 3% lower offer ($252k) is reasonable based on typical stale-listing flexibility.
- Recommended offer: $154k (40.8% below list) — sets the bar for 1% rule.
- Local home prices are declining (-3.0%/yr); year-one equity from $2k of loan paydown is wiped out by about $8k of value loss. Plan a longer hold.
- Location reads 76/100 on livability (#46 in IN, #3,300 nationally) — a middle-class / working-renter tenant base. Strengths: cost of living A+, housing A+, commute A-; Watch: crime D+, employment D+, amenities D.
- Market conditions: 146 active listings in the ZIP; 7 comparable units currently listed for rent nearby; rentals leasing fast (median 2d on market — plan ~1-2 weeks tenant-placement turnaround); solid renter incomes; 911 units permitted in Clark County in 2024 (133 in 5+ unit buildings).
- Clark County population projected at +17% by 2050 — long-run rental-demand tailwind backs the buy-and-hold thesis.
- 3 sale attempts since 15y ago with the ask held roughly flat each time — persistent listings suggest the price (not the market) is what's stuck; bring a comps-based counter.
- Current owner paid $225k; 16% above their basis — modest negotiation headroom, anchor on the comps not their cost.
- Climate carrying-cost: extreme-heat days projected 7→20/yr by 2055 (HVAC capex compounding) — expect insurance premiums to compound above CPI over the hold.
Questions for listing agent
- What do current leases actually rent for vs. the listed asking? Can we see a recent rent roll and the last 12 months of T-12 income?
- It's been on market 44 days. Have you received any prior offers? Is the seller open to a 41% concession, seller financing, or rate buy-down credit?
- Is there a deadline driving the sale (1031 exchange, divorce, estate, relocation)? That informs how much negotiation room exists.
- Schools are D-rated, which usually means shorter tenancies and higher turnover. Who's the typical renter profile here, and what's been the actual vacancy rate?
- Crime grade is D in this area — have there been break-ins, vandalism, or insurance claims at this property in the last 3 years? What carrier currently insures it and at what premium?
- The area grade is low — what's the realistic commute time and amenity access for the typical tenant pool here? Any planned neighborhood developments (good or bad) we should know about?
- What's the average days-on-market for RENTAL listings here right now (not sales)? A rising rental-DOM trend means longer vacancies and softer asking-rent achievability than the comps imply.
- What's the recent tenant-quality profile in this submarket — average credit score on applications, eviction rate, late-payment / NSF rate, and stable-employment percentage? A property-management company in the area should have these aggregated.
CashFlowRE · CFR-VV4P5Q59M3KAFG
· Data 2 days ago
cashflowre.app · 2026-05-29