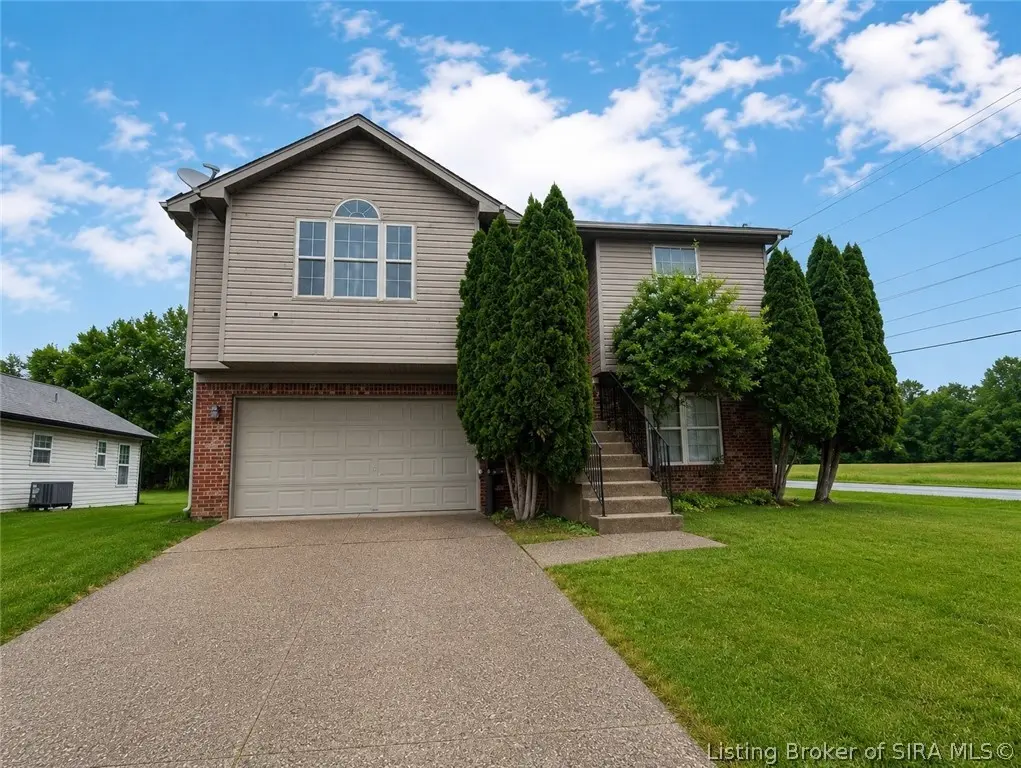
7501 Blue Sky Dr · Clarksville, IN
Flood risk 1/10 · Minimal
- FEMA flood zone
- X (unshaded)
- Chance of flooding over 30 yrs
- 0.0%
- Est. flood insurance / yr
- $473 – $860
Fire risk 1/10 · Minimal
- Est. fire insurance / yr
- $717 – $1,331
Heat risk 5/10 · Moderate
- Hot days now (above 105°F)
- 7 days/yr
- Hot days in 30 yrs
- 20 days/yr
Wind risk 2/10 · Minimal
- Chance of severe wind over 30 yrs
- 2.0%
Air-quality risk 2/10 · Minimal
- Unhealthy air days now
- 1 days/yr
- Unhealthy air days in 30 yrs
- 2 days/yr
Risk factors via First Street. Map © Google.
Why this score? — see what drove the D- grade
The composite is a weighted blend of 9 inputs, each scored 0–100. Each bar is that input's sub-score; the figure is the points it added to the 100-point composite (weight × sub-score).
- ARV discount +15.0/15.0
- Cash flow +6.2/30.0
- Schools +5.0/10.0
- Livability +3.8/5.0
- Rent growth +2.5/5.0
- Condition / age +2.5/5.0
- 1% rule +0.9/10.0
- DSCR +0.5/10.0
- Appreciation +0.0/10.0
$259,900
🖨 Deal sheet 📄 Offer letter ✓ Due diligence
Listing remarks MLS
Check out this awesome home in a great neighborhood in the Silver Creek School district! A must see spacious 3 bedroom, 2 full baths & bi-level. It features larger rooms and a nice eat in kitchen that has a large deck off the back with a nice fenced in back yard! Corner lot! Dont miss out on this great home! Schedule your showing today! sq ft is approximate, if critical buyers should verify. Seller will review all offers on Saturday March 27th at noon
Key facts
- Open views
- Cozy family room
- Eat-in kitchen
Tags
Property features AI
Finance
- HOA & community: Sidewalks in the community
Exterior
- Parking: Attached garage; Garage faces front; 2 garage spaces
- Utilities: Public sewer; Connected to public water
- Home design: Residential property; Below-grade finished living area present
- Construction: Brick, vinyl siding, and frame construction; Poured foundation
- Exterior features: Deck; Porch; Fenced yard; Landscaping; Paved driveway; Corner lot
Interior
- Kitchen: Dishwasher; Disposal; Microwave; Oven; Range; Refrigerator; Eat-in kitchen; Pantry
- Bedrooms: Bedroom on lower level; Bedroom on first level
- Flooring: Linoleum (basement utility and lower/full bath/kitchen areas); Laminate (lower and first level bedrooms); Carpet (family room and living room areas)
- Bathrooms: 2 full bathrooms; Full bathroom on lower level; Full bathroom on first level
- Heating & cooling: Heat pump heating; Central air conditioning
- Interior features: Ceiling fan(s); Entrance foyer; Eat-in kitchen; Primary bedroom with private bath; Main level primary bedroom; Mud room; Pantry; Utility room; Finished basement; Family room
- Laundry & utility: Laundry room in basement; Utility room
Neighborhood map
What this means for you Summary
Snapshot
- This is a 3-bed/2.0-bath single-family listed at $260k.
Deal economics
- At list price, monthly cash flow is $-479 ($-6k/yr) — negative.
- To cash-flow at today's rent, offer at most $175k (32.6% below list).
- To meet the 1% rule (rent ≥ 1% of price), the offer needs to be $154k (40.8% below list).
- Recommended offer: $154k (40.8% below list) — sets the bar for 1% rule.
Location & tenants
- Location reads 76/100 on livability (#46 in IN, #3,300 nationally) — a middle-class / working-renter tenant base. Strengths: cost of living A+, housing A+, commute A-; Watch: crime D+, employment D+, amenities D.
- Market conditions: 146 active listings in the ZIP; 7 comparable units currently listed for rent nearby; rentals leasing fast (median 2d on market — plan ~1-2 weeks tenant-placement turnaround); solid renter incomes; 911 units permitted in Clark County in 2024 (133 in 5+ unit buildings).
Forward outlook
- Local home prices are declining (-3.0%/yr); year-one equity from $2k of loan paydown is wiped out by about $8k of value loss. Plan a longer hold.
- Clark County population projected at +17% by 2050 — long-run rental-demand tailwind backs the buy-and-hold thesis.
Negotiation context
- It's been on market 44 days — a 3% lower offer ($252k) is reasonable based on typical stale-listing flexibility.
- 3 sale attempts since 15y ago with the ask held roughly flat each time — persistent listings suggest the price (not the market) is what's stuck; bring a comps-based counter.
- Current owner paid $225k; 16% above their basis — modest negotiation headroom, anchor on the comps not their cost.
Risks & watch-outs
- Climate carrying-cost: extreme-heat days projected 7→20/yr by 2055 (HVAC capex compounding) — expect insurance premiums to compound above CPI over the hold.
Questions for the listing agent
- What do current leases actually rent for vs. the listed asking? Can we see a recent rent roll and the last 12 months of T-12 income?
- It's been on market 44 days. Have you received any prior offers? Is the seller open to a 41% concession, seller financing, or rate buy-down credit?
- Is there a deadline driving the sale (1031 exchange, divorce, estate, relocation)? That informs how much negotiation room exists.
- Schools are D-rated, which usually means shorter tenancies and higher turnover. Who's the typical renter profile here, and what's been the actual vacancy rate?
- Crime grade is D in this area — have there been break-ins, vandalism, or insurance claims at this property in the last 3 years? What carrier currently insures it and at what premium?
- The area grade is low — what's the realistic commute time and amenity access for the typical tenant pool here? Any planned neighborhood developments (good or bad) we should know about?
- What's the average days-on-market for RENTAL listings here right now (not sales)? A rising rental-DOM trend means longer vacancies and softer asking-rent achievability than the comps imply.
- What's the recent tenant-quality profile in this submarket — average credit score on applications, eviction rate, late-payment / NSF rate, and stable-employment percentage? A property-management company in the area should have these aggregated.
- How much new for-sale + rental construction is in the pipeline within 1–3 miles? Heavy new supply typically softens prices + rents 12–24 months out; constrained supply supports both.
Investment metrics
- 1% rule
- 0.59% ✗
- Cap rate
- 4.08%
- Cash-on-cash
- -7.90%
- DSCR
- 0.65
- GRM
- 14.1
CMA / ARV
- ARV (median comp)
- $328,352
- List price
- $259,900
- Delta
- -20.85%
- Verdict
- UNDERPRICED
- Comps
- 20 within 1.0 mi
Show comp detail 5 sales within ~0.75 mi
| Address | Dist | Beds/Ba | Sqft | Sold | Price | $/sf | Match |
|---|---|---|---|---|---|---|---|
| 3134 White Blossom Cir | 0.55mi | 3/2.0 | 1,642 (-4%) | 9mo | $284,000 | $173 | 60 |
| 1906 Payne Koehler Rd | 0.39mi | 3/2.0 | 1,969 (+15%) | 2mo | $245,000 | $124 | 56 |
| 3101 White Blossom Cir | 0.62mi | 3/2.0 | 1,609 (-6%) | 10mo | $290,000 | $180 | 52 |
| 3101 Honeysuckle Ct | 0.71mi | 3/2.0 | 1,623 (-6%) | 16mo | $305,000 | $188 | 44 |
| 7900 Meyer Loop | 0.69mi | 3/2.0 | 1,482 (-14%) | 4mo | $250,000 | $169 | 42 |
Match score weights: distance 35% · size 25% · config 20% · recency 20%. Top-matched comps best support the ARV.
Projected returns pro-forma
-3.0% appreciation · 3.0% rent growth · sell at horizon
- IRR
- -30.2%
- Equity multiple
- 0.00×
- Total profit
- $-72,674
- Equity at exit
- $38,752
- IRR
- -32.0%
- Equity multiple
- -0.41×
- Total profit
- $-102,740
- Equity at exit
- $22,471
Cash invested: $72,772 (down + closing). Projections, not guarantees.
Landlord ↔ Tenant lean methodology
- Overall (STATE)
- 90 Strongly Landlord-Friendly
- State Indiana
- 90 Strongly Landlord-Friendly · R+11
- County
- — inherits STATE
- City
- — inherits STATE
ZIP-level market 47172
- Active inventory
- 146
- Price-to-rent
- 14.1×
Monthly cashflow live
- Estimated rent
- $1,540 high interval (Pro) →
- Mortgage (P&I)
- −$1,363
- Tax from tax record
- −$224 /mo · $2,690/yr
- Insurance
- −$108
- HOA
- −$0
- Vacancy / Maint / Mgmt
- −$323
- Net cashflow
- $-479
Break-even live
UW: 25.0% down · 7.5% · 30yr · 1.5% tax · 5.0% vac · 8.0% maint · 8.0% mgmt
Financing live
Cash to close
- Down payment
- $64,975
- Closing costs
- $7,797
- Reserves months
- —
- Total cash needed
- —
Loan-product check · same deal, 3 products live
Conventional
25% down · 7.5% · 30yr
- Down + closing
- —
- Monthly P&I
- —
- Monthly cashflow
- —
- DSCR
- —
- Eligible?
- —
Personal DTI + credit; lowest rate.
DSCR
20% down · 8.5% · 30yr
- Down + closing
- —
- Monthly P&I
- —
- Monthly cashflow
- —
- DSCR
- —
- Eligible?
- —
No personal income docs; deal must DSCR.
Hard money
10% down · 12.0% · 12mo
- Down + closing
- —
- Monthly P&I
- —
- Monthly cashflow
- —
- DSCR
- —
- Eligible?
- —
Short-term bridge; refi at stabilization.
Rent comps 7 comps
| Address | Beds | Baths | Sqft | Rent | $/sqft | DOM | Units | Dist |
|---|---|---|---|---|---|---|---|---|
| 7608 Julia Dr Sellersburg, IN | 3.0 | 2.0 | 1500 | $2,000 | $1.33 | 2d | 1 | 0.88mi |
| 7000 Lake Dr Sellersburg, IN | 1.0–3.0 | 1.0–2.0 | 1004 | $1,369 | $1.36 | 2d | 1 | 0.90mi |
| 7722 Sellersburg, IN | 1.0–2.0 | 1.0–2.0 | 933 | $1,143 | $1.23 | 2d | 12 | 0.96mi |
| 1026 Sweet Amy Way Sellersburg, IN | 3.0 | 2.5 | 1288 | $1,850 | $1.44 | 44d | 1 | 1.28mi |
| 2424 Addmore Ln Clarksville, IN | 3.0 | 2.0 | 1080 | $1,250 | $1.16 | 3d | 1 | 1.29mi |
| 8500 Westmont Dr Sellersburg, IN | 2.0 | 2.0 | 1140 | $1,275 | $1.12 | 2d | 5 | 1.35mi |
| 702 Somerset Ct Sellersburg, IN | 2.0 | 2.0 | 1192 | $1,095 | $0.92 | 2d | 1 | 1.42mi |
Listing history 20 events
-
2026-06-18days on market $259,900 Active 44 DOM
-
2026-06-17days on market $259,900 Active 43 DOM
-
2026-06-16days on market $259,900 Active 42 DOM
-
2026-06-15days on market $259,900 Active 41 DOM
-
2026-06-13days on market $259,900 Active 39 DOM
-
2026-06-10days on market $259,900 Active 36 DOM
-
2026-06-09days on market $259,900 Active 35 DOM
-
2026-06-08days on market $259,900 Active 34 DOM
-
2026-06-07days on market $259,900 Active 33 DOM
-
2026-06-03days on market $259,900 Active 29 DOM
-
2026-06-02days on market $259,900 Active 28 DOM
-
2026-06-01days on market $259,900 Active 27 DOM
-
2026-05-31days on market $259,900 Active 26 DOM
-
2026-05-05$259,900 Active 589-char remark
-
2021-05-12soldstatus $225,000 466-char remark
Show marketing remark (466 chars)
Check out this awesome home in a great neighborhood in the Silver Creek School district! A must see spacious 3 bedroom, 2 full baths & bi-level. It features larger rooms and a nice eat in kitchen that has a large deck off the back with a nice fenced in back yard! Corner lot! Dont miss out on this great home! Schedule your showing today! sq ft is approximate, if critical buyers should verify. Seller will review all offers on Saturday March 27th at noon
-
2021-03-22$225,000 466-char remark
Show marketing remark (466 chars)
Check out this awesome home in a great neighborhood in the Silver Creek School district! A must see spacious 3 bedroom, 2 full baths & bi-level. It features larger rooms and a nice eat in kitchen that has a large deck off the back with a nice fenced in back yard! Corner lot! Dont miss out on this great home! Schedule your showing today! sq ft is approximate, if critical buyers should verify. Seller will review all offers on Saturday March 27th at noon
-
2012-02-10soldstatus $125,000
Show marketing remark (445 chars)
The best of both worlds. A nature lover's paradise. This property lends the feel of country living yet close to the conveniences of the city. A must see spacious 3 bedroom, 2 full baths & bi-level. The many upgrades include a new roof & a new wrought iron fenced in yard. Refrigerator not included. Stove is negotiable. Sq ft & rm sz approx. Newly remodeled kitchen includes beautiful marble flooring and silestone countertops.
-
2012-02-10soldstatus $128,000
Show marketing remark (445 chars)
The best of both worlds. A nature lover's paradise. This property lends the feel of country living yet close to the conveniences of the city. A must see spacious 3 bedroom, 2 full baths & bi-level. The many upgrades include a new roof & a new wrought iron fenced in yard. Refrigerator not included. Stove is negotiable. Sq ft & rm sz approx. Newly remodeled kitchen includes beautiful marble flooring and silestone countertops.
-
2011-12-19$128,000
Show marketing remark (445 chars)
The best of both worlds. A nature lover's paradise. This property lends the feel of country living yet close to the conveniences of the city. A must see spacious 3 bedroom, 2 full baths & bi-level. The many upgrades include a new roof & a new wrought iron fenced in yard. Refrigerator not included. Stove is negotiable. Sq ft & rm sz approx. Newly remodeled kitchen includes beautiful marble flooring and silestone countertops.
ⓘ Source: listings_history table (triggers on properties + properties_extension) + one-shot
backfill from property_details.listing_events for pre-trigger history.
Tax reassessment forecast IN · Partial reset (capped growth)
- Current annual tax
- $2,690 · $224/mo
- Projected year-2 tax
- $2,690 · $224/mo
- Expected delta
- $0/yr ($0/mo · 0.0%)
ⓘ Screening estimate from a state-policy table — verify with the county assessor before closing.
Climate risk First Street
- Flood 1/10 Low FEMA zone X (unshaded) · 0% chance over 30 yrs
- Wildfire 1/10 Low
- Heat 5/10 Major 7 d/yr ≥105°F today · 20 d/yr by 30 yrs out
- Wind 2/10 Low 2% chance of damaging wind over 30 yrs
- Air quality 2/10 Low 1 unhealthy d/yr today · 2 by 30 yrs out
Nearby sold comps map
Loading sold comps map…
Walkable amenities ~0.75 mi
Loading nearby amenities…
Taxation est. · year 1
- Rental income
- $18,474
- − Mortgage interest
- −$14,558
- − Property taxes
- −$2,690
- − Insurance
- −$1,300
- − Repairs & maintenance
- −$1,478
- − Management
- −$1,478
- − Depreciation
- −$7,561
- Taxable loss
- −$10,591
- Est. tax savings @ 24.0%
- +$2,542
- After-tax cash flow
- $-3,209/yr
For passive investors: Depreciation is non-cash, so a rental often shows a tax loss while cash-flowing — sheltering income. Rental losses are passive: they offset passive income freely, and up to $25,000/yr can offset ordinary (W-2) income if you actively participate and your MAGI is under $100k (phasing out to $0 by $150k); unused losses carry forward. On sale, claimed depreciation is recaptured at up to 25%, and gains may owe capital-gains tax (a 1031 exchange can defer both). Figures are a year-1 estimate at your 24.0% rate — not tax advice; consult a CPA.
Schools (NCES district)
No district data.
Livability — Clarksville
- Score
- 76/100
- State rank
- #46
- US rank
- #3300
Category grades
Schools grade is shown separately in the Schools card above.
Census & demographics
- Census place
- Clarksville, IN
- County
- Clark County · 108,879 people
- City population
- 19,582
- Metro
- Louisville/Jefferson County, KY-IN
- Population (ZIP)
- 21,045
- Household income
- $82,503
- Rent vs Own
- Severe rent burden
- 250.0
Population outlook (Clark County) Hauer SSP2
- Today (2025)
- 126,401 people
- By 2030
- 131,455 · +4.0%
- By 2040
- 140,471 · +11.1%
- By 2050
- 147,677 · +16.8%
- By 2075
- 161,702 · +27.9%
- By 2100
- 164,078 · +29.8%
Race, ethnicity, and origin ACS 2023
- Neighborhood character
- Predominantly White (90%)
- Race & ethnicity
- White 90% Two or more races 7% Hispanic / Latino 3% Asian 2%
- Common ancestry
- Romanian 2% Slovak 2% Italian 2%
- Foreign-born
- 3% · Canada
- Languages at home
- 96% English-only · Spanish 2% Vietnamese 1% Other Indo-European 1%
Political lean MEDSL · Clark
- 2024 margin
- Strong R (+20.4) · D 38.9% · R 59.3% · Other 1.8%
- 2008→2024 swing
- -13.3pp toward R · 2008: -7.1pp · 2024: -20.4pp
- All cycles
- 2024: R+20.4 2020: R+18.3 2016: R+22.0 2012: R+9.9 2008: R+7.1
Not yet ingested
- Civics
- —
Market trends
- HPI YoY
- ▼ -114.50%
- Current HPI
- 173.6209
- Rent YoY
- —
- Metro
- Louisville/Jefferson County, KY-IN
- State GDP YoY
- ▲ 2.90%
- F500 in state
- 18
Industry mix (Fortune 500 HQ in IN)
| Industry | F500 HQs | Revenue |
|---|---|---|
| Industrial Machinery | 2 | $37B |
|
||
| Healthcare | 1 | $177B |
|
||
| Pharmaceuticals | 1 | $45B |
|
||
| Metals / Steel | 1 | $18B |
|
||
| Agriculture | 1 | $17B |
|
||
| Packaging | 1 | $12B |
|
||
Price history
+103.0% since first listed7 events — show timeline
- 2026-05-05 Listed $259,900 SIRA
- 2021-05-12 Sold (MLS) $225,000 SIRA
- 2021-03-22 Listed $225,000 SIRA
- 2012-02-10 Sold (Public Records) $128,000 Public Records
- 2012-02-10 Sold (Public Records) $128,000 Public Records
- 2012-02-10 Sold (MLS) $125,000 SIRA
- 2011-12-19 Listed $128,000 SIRA
Property tax history
+6.1%/yrLatest (2024): $2,690 · -49.9% YoY. Source: county tax records.
Cash-flow waterfall
monthlySold comps — $/sqft
last 12 mo · ≤1 miLoading sold comps…