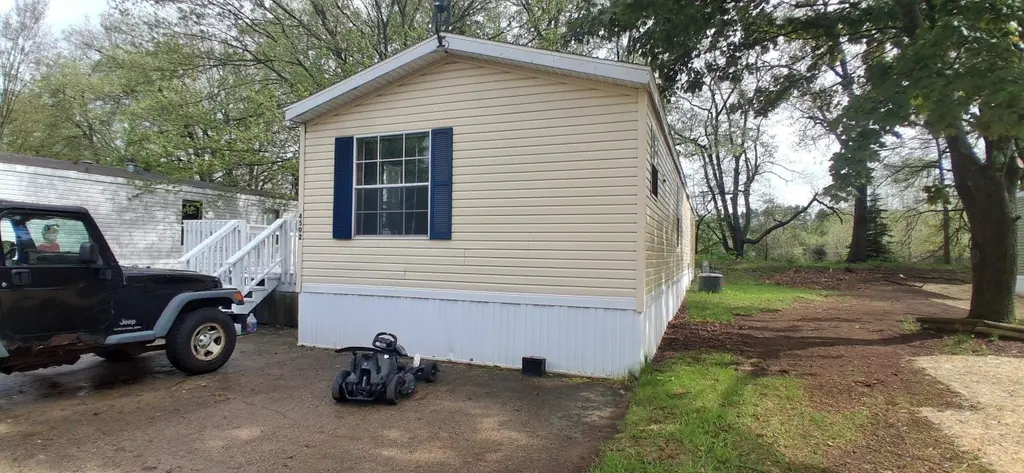
4502 Saturn Dr NE
Algoma, MI 49341
$30,000D+
2 bd · 1.0 ba ·
900 sqft ·
Built 1997
· Manufactured
· Active
· 30 DOM
Cashflow @ list (25.0% down · 7.5%)
Estimated rent
$1,619/mo
Mortgage (P&I)
−$157
Tax + insurance
−$50
HOA
−$626
Vac / Maint / Mgmt
−$340
Net cashflow
$446/mo
Annual
$5,346/yr
Cap rate
24.11%
Cash-on-cash
63.64%
DSCR
3.83
1% rule
5.40%
Cash to close
$8,400
Investor read
- This is a 2-bed/1.0-bath manufactured listed at $30k.
- At list price, monthly cash flow is $446 ($5k/yr) — positive.
- The deal already cash-flows at list — no discount required.
- Meets the 1% rule at list price ($2k rent vs $30k).
- It's been on market 30 days — a 2% lower offer ($30k) is reasonable based on typical stale-listing flexibility.
- Recommended offer: $30k (1.5% below list) — sets the bar for market timing.
- Local home prices are declining (-3.0%/yr); year-one equity from $207 of loan paydown is wiped out by about $900 of value loss. Plan a longer hold.
- Location reads: area grade D — affects rentability + tenant quality, not the cash-flow math above.
- Rockford Public Schools (suburban): math 59% / reading 64% proficiency, ranked #28 of 540 in MI (top 5%) — acceptable for families but not a draw, mixed tenant base, ~2y average lease; only 12% free/reduced lunch — higher-income household profile.
- Zoned schools: Valley View Elementary School (math 70% / reading 72%, grade A-, #69 of 1,397 statewide, top 5%, 631 students, 15% FRL); North Rockford Middle School (math 58% / reading 63%, grade B+, #51 of 493 statewide, top 11%, 885 students, 19% FRL); Rockford High School (math 46% / reading 71%, grade C, #91 of 713 statewide, top 13%, 1,819 students, 14% FRL) — zoned schools at 16% FRL track the district average.
- Watch-outs: HOA is 39% of rent.
- Market conditions: 274 active listings in the ZIP; high-income renter base; 2,253 units permitted in Kent County in 2024 (969 in 5+ unit buildings).
- Kent County population projected at +22% by 2050 — long-run rental-demand tailwind backs the buy-and-hold thesis.
- 3 sale attempts with the ask held roughly flat each time — persistent listings suggest the price (not the market) is what's stuck; bring a comps-based counter.
- At projected returns (-3.0% appreciation + 3.0% rent growth), your $8k cash investment doubles in ~2 years — after that, you're playing with house money.
- This rent is only 17% of the median local income ($114k/yr) — well below the 30% rent-burden line; pricing power to push rent on renewal without tenant pushback.
Questions for listing agent
- What does the HOA fee cover, when was the last increase, and are there any pending special assessments or reserve-fund shortfalls?
- Is there a deadline driving the sale (1031 exchange, divorce, estate, relocation)? That informs how much negotiation room exists.
- The area grade is low — what's the realistic commute time and amenity access for the typical tenant pool here? Any planned neighborhood developments (good or bad) we should know about?
- What's the average days-on-market for RENTAL listings here right now (not sales)? A rising rental-DOM trend means longer vacancies and softer asking-rent achievability than the comps imply.
- What's the recent tenant-quality profile in this submarket — average credit score on applications, eviction rate, late-payment / NSF rate, and stable-employment percentage? A property-management company in the area should have these aggregated.
- How much new for-sale + rental construction is in the pipeline within 1–3 miles? Heavy new supply typically softens prices + rents 12–24 months out; constrained supply supports both.
CashFlowRE · CFR-VVY1Y19M9YR387
· Data 5 h ago
cashflowre.app · 2026-05-29