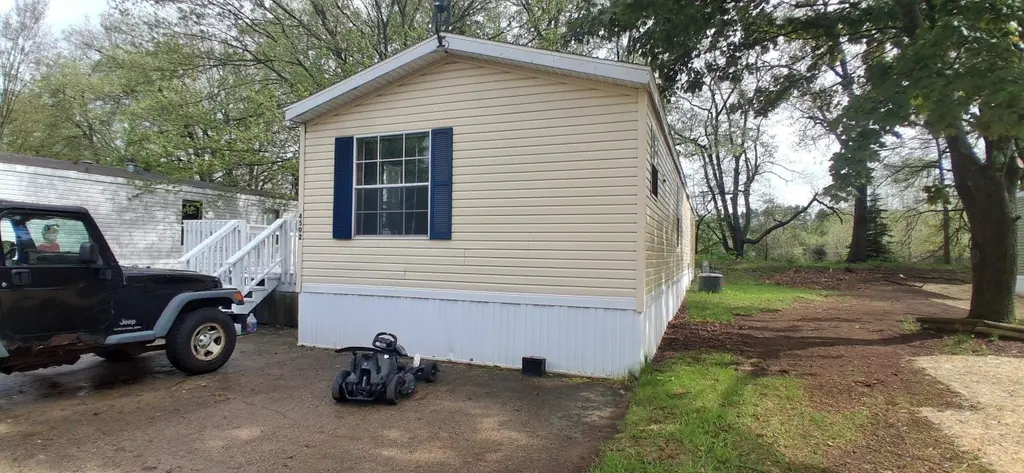
4502 Saturn Dr NE · Algoma, MI
Flood risk No data
- FEMA flood zone
- —
- Chance of flooding over 30 yrs
- —
- Est. flood insurance / yr
- —
Fire risk No data
- Est. fire insurance / yr
- —
Heat risk No data
- Hot days now (above threshold)
- —
- Hot days in 30 yrs
- —
Wind risk No data
- Chance of severe wind over 30 yrs
- —
Air-quality risk No data
- Unhealthy air days now
- —
- Unhealthy air days in 30 yrs
- —
Risk factors via First Street. Map © Google.
Why this score? — see what drove the D+ grade
The composite is a weighted blend of 9 inputs, each scored 0–100. Each bar is that input's sub-score; the figure is the points it added to the 100-point composite (weight × sub-score).
- Cash flow +15.0/30.0
- ARV discount +10.8/15.0
- Schools +5.5/10.0
- 1% rule +5.0/10.0
- DSCR +5.0/10.0
- Rent growth +2.5/5.0
- Livability +2.5/5.0
- Condition / age +2.5/5.0
- Appreciation +0.0/10.0
$30,000
🖨 Deal sheet (PDF) 📄 Offer letter ✓ Due diligence
Listing remarks MLS
Welcome home to Algoma estates, this two-bedroom one bath home has one of the largest decks in the neighborhood, great for those perfect Michigan weather days! Too hot? Sit inside with the comfort of central air and watch nature on your big screen. New Roof in 2025. This home is ready for move in, minutes away from US 131 and in Rockford schools. Schedule your private showing today. 1997 Redman Mobile home in Algoma Estates Community Park. Buyers will need to be approved by the community prior to purchase. Algoma office (616) 866-9383
Key facts
- Largest decks
- Central air
- Built 1997
Tags
Property features AI
Finance
- HOA & community: Monthly association fee; Association fee covers trash; Community playground
Exterior
- Utilities: Public water
- Home design: Residential property; Other architectural style; Built in 1997
- Construction: Vinyl siding
- Exterior features: Shed(s); Public water
Interior
- Kitchen: Oven; Refrigerator
- Bathrooms: 1 full bathroom
- Heating & cooling: Forced air heating; Has cooling
- Interior features: 2 total rooms; Slab foundation/basement
- Laundry & utility: Washer; Dryer; Trash service included in association fee
Neighborhood map
What this means for you Summary
Snapshot
- This is a 2-bed/1.0-bath manufactured listed at $30k.
Deal economics
- At list price, monthly cash flow is $446 ($5k/yr) — positive.
- The deal already cash-flows at list — no discount required.
- Meets the 1% rule at list price ($2k rent vs $30k).
- Recommended offer: $30k (1.5% below list) — sets the bar for market timing.
Location & tenants
- Location reads: area grade D — affects rentability + tenant quality, not the cash-flow math above.
- Rockford Public Schools (suburban): math 59% / reading 64% proficiency, ranked #28 of 540 in MI (top 5%) — acceptable for families but not a draw, mixed tenant base, ~2y average lease; only 12% free/reduced lunch — higher-income household profile.
- Market conditions: 271 active listings in the ZIP; high-income renter base; 2,253 units permitted in Kent County in 2024 (969 in 5+ unit buildings).
- This rent is only 17% of the median local income ($114k/yr) — well below the 30% rent-burden line; pricing power to push rent on renewal without tenant pushback.
Forward outlook
- Local home prices are declining (-3.0%/yr); year-one equity from $207 of loan paydown is wiped out by about $900 of value loss. Plan a longer hold.
- Kent County population projected at +22% by 2050 — long-run rental-demand tailwind backs the buy-and-hold thesis.
- At projected returns (-3.0% appreciation + 3.0% rent growth), your $8k cash investment doubles in ~2 years — after that, you're playing with house money.
Negotiation context
- It's been on market 27 days — a 2% lower offer ($30k) is reasonable based on typical stale-listing flexibility.
- 3 sale attempts with the ask held roughly flat each time — persistent listings suggest the price (not the market) is what's stuck; bring a comps-based counter.
Risks & watch-outs
- Watch-outs: HOA is 39% of rent.
Questions for the listing agent
- What does the HOA fee cover, when was the last increase, and are there any pending special assessments or reserve-fund shortfalls?
- Is there a deadline driving the sale (1031 exchange, divorce, estate, relocation)? That informs how much negotiation room exists.
- The area grade is low — what's the realistic commute time and amenity access for the typical tenant pool here? Any planned neighborhood developments (good or bad) we should know about?
- What's the average days-on-market for RENTAL listings here right now (not sales)? A rising rental-DOM trend means longer vacancies and softer asking-rent achievability than the comps imply.
- What's the recent tenant-quality profile in this submarket — average credit score on applications, eviction rate, late-payment / NSF rate, and stable-employment percentage? A property-management company in the area should have these aggregated.
- How much new for-sale + rental construction is in the pipeline within 1–3 miles? Heavy new supply typically softens prices + rents 12–24 months out; constrained supply supports both.
Investment metrics
- 1% rule
- 5.40% ✓
- Cap rate
- 24.11%
- Cash-on-cash
- 63.64%
- DSCR
- 3.83
- GRM
- 1.5
CMA / ARV
- ARV (on-the-fly)
- $32,400
- Comps found
- 1
Show comp detail 1 sale within ~0.75 mi
| Address | Dist | Beds/Ba | Sqft | Sold | Price | $/sf | Match |
|---|---|---|---|---|---|---|---|
| 10610 Orion Dr NE | 0.30mi | 3/2.0 (+1) | 888 (-1%) | 3mo | $32,000 | $36 | 73 |
Match score weights: distance 35% · size 25% · config 20% · recency 20%. Top-matched comps best support the ARV.
Projected returns pro-forma
-3.0% appreciation · 3.0% rent growth · sell at horizon
- IRR
- 63.2%
- Equity multiple
- 3.85×
- Total profit
- $23,923
- Equity at exit
- $4,473
- IRR
- 67.9%
- Equity multiple
- 8.03×
- Total profit
- $59,031
- Equity at exit
- $2,594
Cash invested: $8,400 (down + closing). Projections, not guarantees.
Landlord ↔ Tenant lean methodology
- Overall (STATE)
- 62 Landlord-Friendly
- State Michigan
- 62 Landlord-Friendly · EVEN
- County
- — inherits STATE
- City
- — inherits STATE
ZIP-level market 49341
- Home prices YoY
- -33.8%
- Active inventory
- 271
- Price-to-rent
- 1.5×
Monthly cashflow live
- Estimated rent
- $1,619 medium interval (Pro) →
- Mortgage (P&I)
- −$157
- Tax est. 1.5%
- −$38 /mo · $450/yr
- Insurance
- −$12
- HOA
- −$626
- Vacancy / Maint / Mgmt
- −$340
- Net cashflow
- $446
Break-even live
Sensitivity live
| Price | -10% $466 | -5% $456 | +0% $446 | +5% $435 | +10% $425 |
|---|---|---|---|---|---|
| Rent | -10% $318 | -5% $382 | +0% $446 | +5% $509 | +10% $573 |
| Rate | -1.0pp $461 | -0.5pp $453 | base $446 | +0.5pp $438 | +1.0pp $430 |
UW: 25.0% down · 7.5% · 30yr · 1.5% tax · 5.0% vac · 8.0% maint · 8.0% mgmt
Financing live
Cash to close
- Down payment
- $7,500
- Closing costs
- $900
- Reserves months
- —
- Total cash needed
- —
Loan-product check · same deal, 3 products live
Conventional
25% down · 7.5% · 30yr
- Down + closing
- —
- Monthly P&I
- —
- Monthly cashflow
- —
- DSCR
- —
- Eligible?
- —
Personal DTI + credit; lowest rate.
DSCR
20% down · 8.5% · 30yr
- Down + closing
- —
- Monthly P&I
- —
- Monthly cashflow
- —
- DSCR
- —
- Eligible?
- —
No personal income docs; deal must DSCR.
Hard money
10% down · 12.0% · 12mo
- Down + closing
- —
- Monthly P&I
- —
- Monthly cashflow
- —
- DSCR
- —
- Eligible?
- —
Short-term bridge; refi at stabilization.
HOA detail
- Monthly dues
- $626 · $7,512/yr
Listing history 18 events
-
2026-06-18days on market $30,000 Active 27 DOM
-
2026-06-17days on market $30,000 Active 26 DOM
-
2026-06-16days on market $30,000 Active 25 DOM
-
2026-06-15days on market $30,000 Active 24 DOM
-
2026-06-14days on market $30,000 Active 22 DOM
-
2026-06-13days on market $30,000 Active 21 DOM
-
2026-06-10days on market $30,000 Active 19 DOM
-
2026-06-09days on market $30,000 Active 18 DOM
-
2026-06-08days on market $30,000 Active 17 DOM
-
2026-06-07days on market $30,000 Active 16 DOM
-
2026-06-05days on market $30,000 Active 13 DOM
-
2026-06-03days on market $30,000 Active 12 DOM
-
2026-06-03days on market $30,000 Active 11 DOM
-
2026-06-01days on market $30,000 Active 10 DOM
-
2026-05-31days on market $30,000 Active 9 DOM
-
2026-05-21$30,000 Active
Show marketing remark (540 chars)
Welcome home to Algoma estates, this two-bedroom one bath home has one of the largest decks in the neighborhood, great for those perfect Michigan weather days! Too hot? Sit inside with the comfort of central air and watch nature on your big screen. New Roof in 2025. This home is ready for move in, minutes away from US 131 and in Rockford schools. Schedule your private showing today. 1997 Redman Mobile home in Algoma Estates Community Park. Buyers will need to be approved by the community prior to purchase. Algoma office (616) 866-9383
-
2026-05-21$30,000 Active 540-char remark
Show marketing remark (540 chars)
Welcome home to Algoma estates, this two-bedroom one bath home has one of the largest decks in the neighborhood, great for those perfect Michigan weather days! Too hot? Sit inside with the comfort of central air and watch nature on your big screen. New Roof in 2025. This home is ready for move in, minutes away from US 131 and in Rockford schools. Schedule your private showing today. 1997 Redman Mobile home in Algoma Estates Community Park. Buyers will need to be approved by the community prior to purchase. Algoma office (616) 866-9383
ⓘ Source: listings_history table (triggers on properties + properties_extension) + one-shot
backfill from property_details.listing_events for pre-trigger history.
Nearby sold comps map
Loading sold comps map…
Walkable amenities ~0.75 mi
Loading nearby amenities…
Taxation est. · year 1
- Rental income
- $19,425
- − Mortgage interest
- −$1,680
- − Property taxes
- −$450
- − Insurance
- −$150
- − Repairs & maintenance
- −$1,554
- − Management
- −$1,554
- − HOA
- −$7,512
- − Depreciation
- −$873
- Taxable income
- $5,652
- Est. tax owed @ 24.0%
- −$1,357
- After-tax cash flow
- $3,990/yr
For passive investors: Depreciation is non-cash, so a rental often shows a tax loss while cash-flowing — sheltering income. Rental losses are passive: they offset passive income freely, and up to $25,000/yr can offset ordinary (W-2) income if you actively participate and your MAGI is under $100k (phasing out to $0 by $150k); unused losses carry forward. On sale, claimed depreciation is recaptured at up to 25%, and gains may owe capital-gains tax (a 1031 exchange can defer both). Figures are a year-1 estimate at your 24.0% rate — not tax advice; consult a CPA.
Schools (NCES district)
- District
- Rockford Public Schools
- NCES district ID
- 2630030
- Math proficiency
- 59% ▼ -5.00%
- Reading proficiency
- 64% ▼ -2.00%
- Median HH income
- $79,800
- Composite
- 55.16/100
- National rank
- #1276
- State rank
- #28 of 540 in MI
Livability — Algoma
No livability data for this city. (Only ~50 U.S. cities are tracked.)
Census & demographics
- County
- Kent County · 533,805 people
- Metro
- Grand Rapids-Kentwood, MI
- Population (ZIP)
- 39,409
- Household income
- $113,989
- Rent vs Own
- Severe rent burden
- 293.0
Population outlook (Kent County) Hauer SSP2
- Today (2025)
- 712,484 people
- By 2030
- 748,618 · +5.1%
- By 2040
- 814,777 · +14.4%
- By 2050
- 868,556 · +21.9%
- By 2075
- 966,487 · +35.7%
- By 2100
- 967,975 · +35.9%
Race, ethnicity, and origin ACS 2023
- Neighborhood character
- Predominantly White (90%)
- Race & ethnicity
- White 90% Two or more races 5% Hispanic / Latino 4%
- Common ancestry
- Iranian 15% Romanian 9% Lithuanian 4%
- Foreign-born
- 2% · Canada
- Languages at home
- 97% English-only · Spanish 2%
Political lean MEDSL · Kent
- 2024 margin
- Lean D (+5.4) · D 51.8% · R 46.5% · Other 1.7%
- 2008→2024 swing
- +4.8pp toward D · 2008: 0.5pp · 2024: 5.4pp
- All cycles
- 2024: D+5.4 2020: D+6.1 2016: R+3.1 2012: R+7.9 2008: D+0.5
Not yet ingested
- Civics
- —
Market trends
- HPI YoY
- ▼ -131.59%
- Current HPI
- 257.3691
- Rent YoY
- —
- Metro
- Grand Rapids-Kentwood, MI
- State GDP YoY
- ▲ 1.37%
- F500 in state
- 28
Industry mix (Fortune 500 HQ in MI)
| Industry | F500 HQs | Revenue |
|---|---|---|
| Automotive Parts | 3 | $48B |
|
||
| Automotive | 2 | $372B |
|
||
| Chemicals | 1 | $45B |
|
||
| Automotive Retail | 1 | $29B |
|
||
| Healthcare / Medical Devices | 1 | $23B |
|
||
| Automotive Technology | 1 | $20B |
|
||
Price history
+0.0% since first listed3 events — show timeline
- 2026-05-21 Listed $30,000 MiRealSource-MiMLS
- 2026-05-21 Listed $30,000 REALCOMP
- 2026-05-21 Listed $30,000 SW Michigan MLS
Cash-flow waterfall
monthlySold comps — $/sqft
last 12 mo · ≤1 miLoading sold comps…