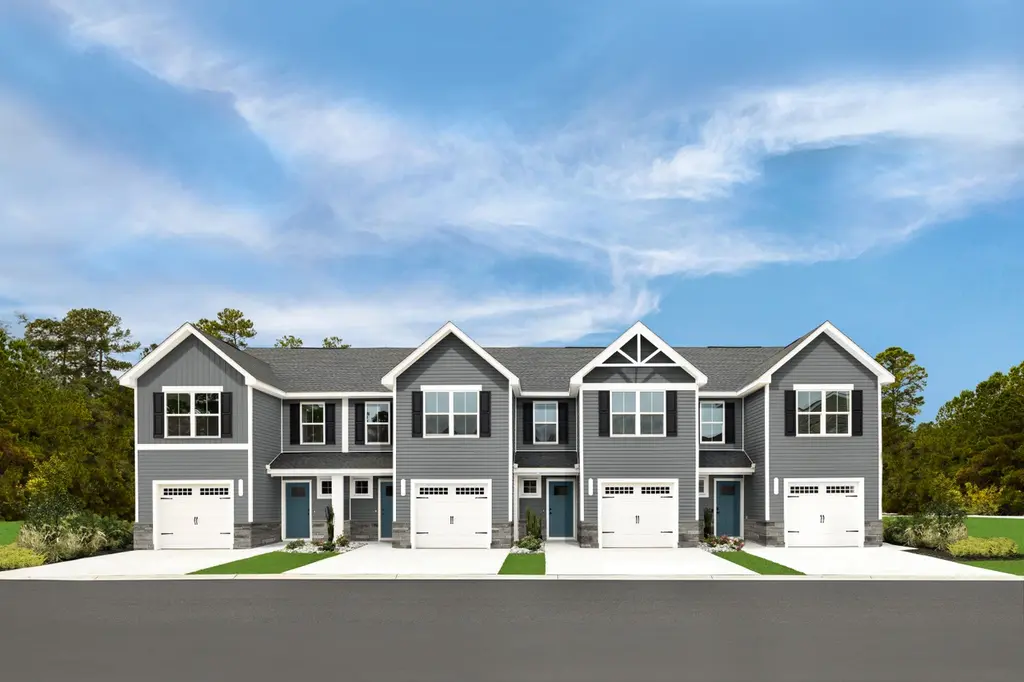
Pine Plan
Kent, OH 44240
$249,990D
3 bd · 2.0 ba ·
1,498 sqft ·
Built —
· Townhouse
· Active
· 14 DOM
Cashflow @ list (25.0% down · 7.5%)
Estimated rent
$2,079/mo
Mortgage (P&I)
−$1,311
Tax + insurance
−$417
HOA
−$0
Vac / Maint / Mgmt
−$437
Net cashflow
$-85/mo
Annual
$-1,025/yr
Cap rate
5.88%
Cash-on-cash
-1.46%
DSCR
0.93
1% rule
0.83%
Cash to close
$69,997
Investor read
- This is a 3-bed/2.0-bath townhouse listed at $250k. Condition is rated excellent.
- At list price, monthly cash flow is $-85 ($-1k/yr) — negative.
- To cash-flow at today's rent, offer at most $238k (4.9% below list).
- To meet the 1% rule (rent ≥ 1% of price), the offer needs to be $208k (16.8% below list).
- Only 14 days on market — expect competitive offers; lowballing is unlikely to land.
- Recommended offer: $208k (16.8% below list) — sets the bar for 1% rule.
- Local home prices are declining (-3.0%/yr); year-one equity from $2k of loan paydown is wiped out by about $8k of value loss. Plan a longer hold.
- Location reads 89/100 on livability (#13 in OH, #129 nationally) — a professional / high-income tenant draw. Strengths: amenities A+, commute A+, cost of living A+; Watch: employment F.
- Field Local (rural): math 65% / reading 66% proficiency, ranked #198 of 656 in OH (top 30%) — acceptable for families but not a draw, mixed tenant base, ~2y average lease.
- Zoned schools: Brimfield Elementary School (math 69% / reading 62%, grade B+, #510 of 1,584 statewide, top 32%, 528 students, 38% FRL); Field Middle School (math 66% / reading 63%, grade A-, #205 of 654 statewide, top 34%, 444 students, 31% FRL); Field High School (math 52% / reading 72%, grade B-, #202 of 781 statewide, top 29%, 524 students, 24% FRL) — zoned schools at 31% FRL track the district average.
- Market conditions: Rents rising fast (+6.8%/yr); 143 active listings in the ZIP; 3 comparable units currently listed for rent nearby; rentals lingering (median 46d on market — plan ~5-8 weeks vacancy on turnover, expect pricing pressure); 67% of comp listings sitting > 30 days — soft ceiling on asking rent; 196 units permitted in Portage County in 2024 (10 in 5+ unit buildings).
- Cap rate 5.9% vs local median 4.1% in Kent — top-decile yield for the area; either an underpriced asset or a hidden risk that comps aren't pricing in. Stress-test before assuming the spread holds.
- This rent runs 43% of the median local income ($58k/yr) — at the standard rent-burdened threshold; future hikes will face affordability resistance.
Questions for listing agent
- What do current leases actually rent for vs. the listed asking? Can we see a recent rent roll and the last 12 months of T-12 income?
- Is there a deadline driving the sale (1031 exchange, divorce, estate, relocation)? That informs how much negotiation room exists.
- Schools are A-rated — typically a magnet for longer-tenancy family renters. What's the average tenant stay here, and is there a school-zone premium baked into asking?
- The area grade is low — what's the realistic commute time and amenity access for the typical tenant pool here? Any planned neighborhood developments (good or bad) we should know about?
- What's the average days-on-market for RENTAL listings here right now (not sales)? A rising rental-DOM trend means longer vacancies and softer asking-rent achievability than the comps imply.
- What's the recent tenant-quality profile in this submarket — average credit score on applications, eviction rate, late-payment / NSF rate, and stable-employment percentage? A property-management company in the area should have these aggregated.
- How much new for-sale + rental construction is in the pipeline within 1–3 miles? Heavy new supply typically softens prices + rents 12–24 months out; constrained supply supports both.
CashFlowRE · CFR-VX4M7CFQRVQ8Z3
· Data 22 h ago
cashflowre.app · 2026-05-29