 🏗️ New Construction
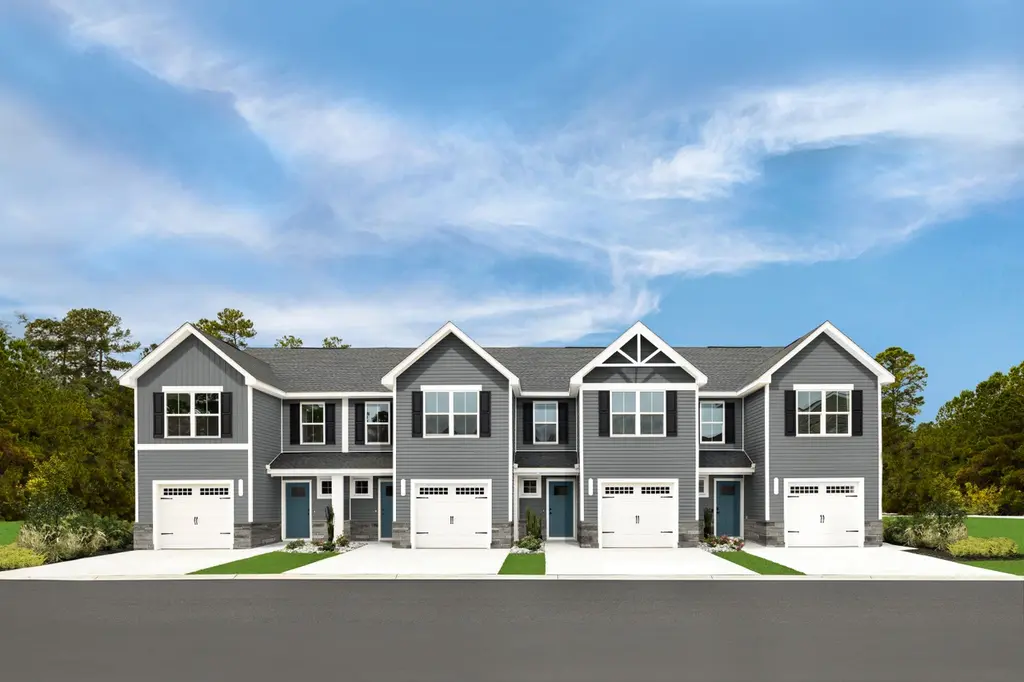
Pine Plan · Kent, OH
Flood risk 1/10 · Minimal
- FEMA flood zone
- X (unshaded)
- Chance of flooding over 30 yrs
- 0.0%
- Est. flood insurance / yr
- $507 – $1,088
Fire risk 1/10 · Minimal
- Est. fire insurance / yr
- $713 – $1,323
Heat risk 2/10 · Minimal
- Hot days now (above 96°F)
- 7 days/yr
- Hot days in 30 yrs
- 16 days/yr
Wind risk 1/10 · Minimal
- Chance of severe wind over 30 yrs
- —
Air-quality risk 3/10 · Minor
- Unhealthy air days now
- 2 days/yr
- Unhealthy air days in 30 yrs
- 3 days/yr
Risk factors via First Street. Map © Google.
Why this score? — see what drove the D grade
The composite is a weighted blend of 9 inputs, each scored 0–100. Each bar is that input's sub-score; the figure is the points it added to the 100-point composite (weight × sub-score).
- Cash flow +11.4/30.0
- ARV discount +7.5/15.0
- Schools +5.6/10.0
- Condition / age +4.8/5.0
- Livability +4.5/5.0
- Rent growth +4.2/5.0
- 1% rule +3.3/10.0
- DSCR +3.3/10.0
- Appreciation +0.0/10.0
$249,990
🖨 Deal sheet (PDF) 📄 Offer letter ✓ Due diligence
Listing remarks
The Pine townhome blends sensibility and style. Enter the welcoming foyer from the covered porch or through the garage. It's the perfect location for a family zone. The wide-open great room flows seamlessly into the gourmet kitchen and light-filled dining area, where an optional island can provide extra storage and counter space. Upstairs, find two generous secondary bedrooms and a full bath; continue past the laundry toward the owner's suite. This private retreat includes a dual vanity bath and enormous walk-in closet. The full unfinished basement can be used as you wish! The Pine is perfect for your family.
Key facts
- Covered porch
- Welcoming foyer
- Gourmet kitchen
Tags
Property features AI
Finance
- Other: Address: Pine Plan, Kent, OH 44240; Listing status: Active
- Financial info: List price $249,990
Exterior
- Parking: 1 parking space
- Utilities: Has cooling (central air)
- Home design: Plan home named Pine; New construction plan
- Exterior features: Living area approximately 1498
Interior
- Bedrooms: 3 bedrooms
- Bathrooms: 2 full bathrooms
- Heating & cooling: Central air conditioning
- Interior features: Central air conditioning
Neighborhood map
What this means for you Summary
Snapshot
- This is a 3-bed/2.0-bath townhouse listed at $250k. Condition is rated excellent.
Deal economics
- At list price, monthly cash flow is $-85 ($-1k/yr) — negative.
- To cash-flow at today's rent, offer at most $238k (4.9% below list).
- To meet the 1% rule (rent ≥ 1% of price), the offer needs to be $208k (16.8% below list).
- Recommended offer: $208k (16.8% below list) — sets the bar for 1% rule.
- Cap rate 5.9% vs local median 4.1% in Kent — top-decile yield for the area; either an underpriced asset or a hidden risk that comps aren't pricing in. Stress-test before assuming the spread holds.
Location & tenants
- Location reads 89/100 on livability (#13 in OH, #129 nationally) — a professional / high-income tenant draw. Strengths: amenities A+, commute A+, cost of living A+; Watch: employment F.
- Field Local (rural): math 65% / reading 66% proficiency, ranked #198 of 656 in OH (top 30%) — acceptable for families but not a draw, mixed tenant base, ~2y average lease.
- Zoned schools: Brimfield Elementary School (math 69% / reading 62%, grade B+, #510 of 1,584 statewide, top 32%, 528 students, 38% FRL); Field Middle School (math 66% / reading 63%, grade A-, #205 of 654 statewide, top 34%, 444 students, 31% FRL); Field High School (math 52% / reading 72%, grade B-, #202 of 781 statewide, top 29%, 524 students, 24% FRL) — zoned schools at 31% FRL track the district average.
- Market conditions: Rents rising fast (+6.8%/yr); 143 active listings in the ZIP; 3 comparable units currently listed for rent nearby; rentals lingering (median 46d on market — plan ~5-8 weeks vacancy on turnover, expect pricing pressure); 67% of comp listings sitting > 30 days — soft ceiling on asking rent; 196 units permitted in Portage County in 2024 (10 in 5+ unit buildings).
- This rent runs 43% of the median local income ($58k/yr) — at the standard rent-burdened threshold; future hikes will face affordability resistance.
Forward outlook
- Local home prices are declining (-3.0%/yr); year-one equity from $2k of loan paydown is wiped out by about $8k of value loss. Plan a longer hold.
Negotiation context
- Only 14 days on market — expect competitive offers; lowballing is unlikely to land.
Questions for the listing agent
- What do current leases actually rent for vs. the listed asking? Can we see a recent rent roll and the last 12 months of T-12 income?
- Is there a deadline driving the sale (1031 exchange, divorce, estate, relocation)? That informs how much negotiation room exists.
- Schools are A-rated — typically a magnet for longer-tenancy family renters. What's the average tenant stay here, and is there a school-zone premium baked into asking?
- The area grade is low — what's the realistic commute time and amenity access for the typical tenant pool here? Any planned neighborhood developments (good or bad) we should know about?
- What's the average days-on-market for RENTAL listings here right now (not sales)? A rising rental-DOM trend means longer vacancies and softer asking-rent achievability than the comps imply.
- What's the recent tenant-quality profile in this submarket — average credit score on applications, eviction rate, late-payment / NSF rate, and stable-employment percentage? A property-management company in the area should have these aggregated.
- How much new for-sale + rental construction is in the pipeline within 1–3 miles? Heavy new supply typically softens prices + rents 12–24 months out; constrained supply supports both.
Investment metrics
- 1% rule
- 0.83% ✗
- Cap rate
- 5.88%
- Cash-on-cash
- -1.46%
- DSCR
- 0.93
- GRM
- 10.0
CMA / ARV
No comps found within radius.
Projected returns pro-forma
-3.0% appreciation · 6.8% rent growth · sell at horizon
- IRR
- -14.5%
- Equity multiple
- 0.46×
- Total profit
- $-37,667
- Equity at exit
- $37,274
- IRR
- -0.5%
- Equity multiple
- 0.96×
- Total profit
- $-3,059
- Equity at exit
- $21,615
Cash invested: $69,997 (down + closing). Projections, not guarantees.
Landlord ↔ Tenant lean methodology
- Overall (STATE)
- 73 Landlord-Friendly
- State Ohio
- 73 Landlord-Friendly · R+6
- County
- — inherits STATE
- City
- — inherits STATE
ZIP-level market 44240
- Rents YoY
- 6.8%
- Active inventory
- 143
- Price-to-rent
- 10.0×
Monthly cashflow live
- Estimated rent
- $2,079 medium interval (Pro) →
- Mortgage (P&I)
- −$1,311
- Tax est. 1.5%
- −$312 /mo · $3,750/yr
- Insurance
- −$104
- HOA
- −$0
- Vacancy / Maint / Mgmt
- −$437
- Net cashflow
- $-85
Break-even live
Sensitivity live
| Price | -10% $87 | -5% $1 | +0% $-85 | +5% $-172 | +10% $-258 |
|---|---|---|---|---|---|
| Rent | -10% $-250 | -5% $-168 | +0% $-85 | +5% $-3 | +10% $79 |
| Rate | -1.0pp $40 | -0.5pp $-22 | base $-85 | +0.5pp $-150 | +1.0pp $-216 |
UW: 25.0% down · 7.5% · 30yr · 1.5% tax · 5.0% vac · 8.0% maint · 8.0% mgmt
Financing live
Cash to close
- Down payment
- $62,498
- Closing costs
- $7,500
- Reserves months
- —
- Total cash needed
- —
Loan-product check · same deal, 3 products live
Conventional
25% down · 7.5% · 30yr
- Down + closing
- —
- Monthly P&I
- —
- Monthly cashflow
- —
- DSCR
- —
- Eligible?
- —
Personal DTI + credit; lowest rate.
DSCR
20% down · 8.5% · 30yr
- Down + closing
- —
- Monthly P&I
- —
- Monthly cashflow
- —
- DSCR
- —
- Eligible?
- —
No personal income docs; deal must DSCR.
Hard money
10% down · 12.0% · 12mo
- Down + closing
- —
- Monthly P&I
- —
- Monthly cashflow
- —
- DSCR
- —
- Eligible?
- —
Short-term bridge; refi at stabilization.
Rent comps 3 comps
| Address | Beds | Baths | Sqft | Rent | $/sqft | DOM | Units | Dist |
|---|---|---|---|---|---|---|---|---|
| 356 Cherry St Unit NA Kent, OH | 3.0 | 1.5 | 1175 | $1,900 | $1.62 | 45d | 1 | 1.30mi |
| 213 Dodge St Unit 1 Kent, OH | 3.0 | 1.0 | 1100 | $1,400 | $1.27 | 45d | 1 | 1.34mi |
| 1405 Wyles Dr Brimfield, OH | 2.0–3.0 | 2.0 | 1444 | $2,755 | $1.91 | 15d | 1 | 1.47mi |
Listing history 10 events
-
2026-06-21days on market $249,990 Active 14 DOM
-
2026-06-18days on market $249,990 Active 11 DOM
-
2026-06-17days on market $249,990 Active 10 DOM
-
2026-06-16days on market $249,990 Active 9 DOM
-
2026-06-15days on market $249,990 Active 8 DOM
-
2026-06-14days on market $249,990 Active 6 DOM
-
2026-06-10days on market $249,990 Active 3 DOM
-
2026-06-09days on market $249,990 Active 2 DOM
-
2026-06-07remarks 616-char remark
-
2026-06-07$249,990 Active 1 DOM
ⓘ Source: listings_history table (triggers on properties + properties_extension) + one-shot
backfill from property_details.listing_events for pre-trigger history.
Climate risk First Street
- Flood 1/10 Low FEMA zone X (unshaded) · 0% chance over 30 yrs
- Wildfire 1/10 Low
- Heat 2/10 Low 7 d/yr ≥96°F today · 16 d/yr by 30 yrs out
- Wind 1/10 Low
- Air quality 3/10 Moderate 2 unhealthy d/yr today · 3 by 30 yrs out
Nearby sold comps map
Loading sold comps map…
Walkable amenities ~0.75 mi
Loading nearby amenities…
Taxation est. · year 1
- Rental income
- $24,945
- − Mortgage interest
- −$14,003
- − Property taxes
- −$3,750
- − Insurance
- −$1,250
- − Repairs & maintenance
- −$1,996
- − Management
- −$1,996
- − Depreciation
- −$7,272
- Taxable loss
- −$5,322
- Est. tax savings @ 24.0%
- +$1,277
- After-tax cash flow
- $252/yr
For passive investors: Depreciation is non-cash, so a rental often shows a tax loss while cash-flowing — sheltering income. Rental losses are passive: they offset passive income freely, and up to $25,000/yr can offset ordinary (W-2) income if you actively participate and your MAGI is under $100k (phasing out to $0 by $150k); unused losses carry forward. On sale, claimed depreciation is recaptured at up to 25%, and gains may owe capital-gains tax (a 1031 exchange can defer both). Figures are a year-1 estimate at your 24.0% rate — not tax advice; consult a CPA.
Condition & rehab AI · 13 photos
This townhome is in excellent condition with a modern kitchen, good exterior, and hardwood flooring. It is move-in ready and has the potential for further value increases through landscaping and smart home features.
Value-add opportunities
- Both Landscaping and curb appeal — Enhanced landscaping can improve both the resale and rental value.
- Both Add smart home features — Smart home features can increase both the resale and rental value by making the home more modern and convenient.
Renovation cost estimate screening
Value-add ROI direction
- Both Landscaping and curb appeal — Enhanced landscaping can improve both the resale and rental value. ↑
- Both Add smart home features — Smart home features can increase both the resale and rental value by making the home more modern and convenient. ↑
ⓘ Cost ranges are severity-bucket heuristics (US national rule-of-thumb). Get contractor quotes + a written scope before underwriting a rehab budget.
Schools (NCES district)
- District
- Field Local
- NCES district ID
- 3904919
- Math proficiency
- 65% ▼ -9.00%
- Reading proficiency
- 66% ▼ -8.00%
- Median HH income
- $54,727
- Composite
- 56.09/100
- National rank
- #1183
- State rank
- #198 of 656 in OH
Livability — Kent
- Score
- 89/100
- State rank
- #13
- US rank
- #129
Category grades
Schools grade is shown separately in the Schools card above.
Census & demographics
- County
- Portage County · 70,400 people
- City population
- 37,788
- Metro
- Akron, OH
- Population (ZIP)
- 37,788
- Household income
- $57,627
- Rent vs Own
- Severe rent burden
- 2634.0
Population outlook (Portage County) Hauer SSP2
- Today (2025)
- 166,109 people
- By 2030
- 167,752 · +1.0%
- By 2040
- 168,640 · +1.5%
- By 2050
- 167,469 · +0.8%
- By 2075
- 170,131 · +2.4%
- By 2100
- 167,958 · +1.1%
Race, ethnicity, and origin ACS 2023
- Neighborhood character
- Predominantly White (83%)
- Race & ethnicity
- White 83% Two or more races 6% Black 6% Asian 4% Hispanic / Latino 3%
- Common ancestry
- Romanian 7% Slovak 2% Italian 2%
- Foreign-born
- 7% · Canada, China
- Languages at home
- 92% English-only · Other Indo-European 2% Arabic 2% Other Asian/Pacific 1%
Political lean MEDSL · Portage
- 2024 margin
- R (+15.5) · D 41.8% · R 57.3%
- 2008→2024 swing
- -24.5pp toward R · 2008: 9.0pp · 2024: -15.5pp
- All cycles
- 2024: R+15.5 2020: R+12.5 2016: R+10.2 2012: D+4.9 2008: D+9.0
Not yet ingested
- Civics
- —
Market trends
- HPI YoY
- ▼ -162.04%
- Current HPI
- 189.3174
- Rent YoY
- ▲ 6.80%
- Metro
- Akron, OH
- State GDP YoY
- ▲ 1.98%
- F500 in state
- 48
Industry mix (Fortune 500 HQ in OH)
| Industry | F500 HQs | Revenue |
|---|---|---|
| Insurance | 3 | $145B |
|
||
| Industrial Machinery | 3 | $49B |
|
||
| Financial Services | 3 | $24B |
|
||
| Consumer Goods | 2 | $93B |
|
||
| Aerospace / Defense | 2 | $47B |
|
||
| Utilities | 2 | $33B |
|
||
Cash-flow waterfall
monthlySold comps — $/sqft
last 12 mo · ≤1 miLoading sold comps…