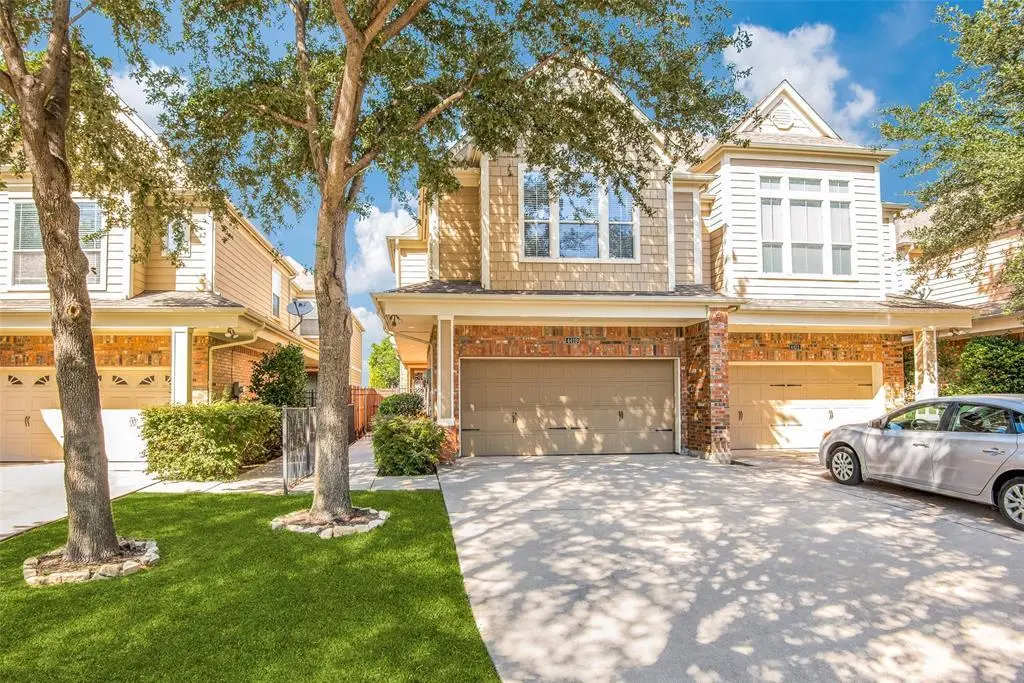
4419 W University Blvd
Dallas, TX 75209
$587,500D+
3 bd · 2.5 ba ·
2,687 sqft ·
Built 2006
· SingleFamily
· Pending
· 44 DOM
Cashflow @ list (25.0% down · 7.5%)
Estimated rent
$5,480/mo
Mortgage (P&I)
−$3,081
Tax + insurance
−$1,364
HOA
−$0
Vac / Maint / Mgmt
−$1,151
Net cashflow
$-115/mo
Annual
$-1,384/yr
Cap rate
6.06%
Cash-on-cash
-0.84%
DSCR
0.96
1% rule
0.93%
Cash to close
$164,500
Investor read
- This is a 3-bed/2.5-bath single-family listed at $588k.
- At list price, monthly cash flow is $-115 ($-1k/yr) — negative.
- To cash-flow at today's rent, offer at most $567k (3.5% below list).
- To meet the 1% rule (rent ≥ 1% of price), the offer needs to be $548k (6.7% below list).
- It's been on market 44 days — a 3% lower offer ($570k) is reasonable based on typical stale-listing flexibility.
- Recommended offer: $548k (6.7% below list) — sets the bar for 1% rule.
- Local home prices are declining (-3.0%/yr); year-one equity from $4k of loan paydown is wiped out by about $18k of value loss. Plan a longer hold.
- Location reads 81/100 on livability (#24 in TX, #1,380 nationally) — a professional / high-income tenant draw. Strengths: amenities A+, commute A+, housing A+; Watch: crime F.
- Dallas ISD (urban): math 31% / reading 36% proficiency, ranked #559 of 826 in TX (top 68%) — families likely to look elsewhere, expect single-tenant / working-renter base with shorter leases; 83% free/reduced lunch — lower-income household profile, screen leases tightly.
- Zoned schools: K B Polk Center For Academically Talented & Gifted (math 22% / reading 22%, grade F, #3,333 of 4,322 statewide, top 80%, 412 students, 82% FRL); D A Hulcy Steam Middle (math 33% / reading 32%, grade F, #947 of 1,662 statewide, top 58%, 423 students, 88% FRL); Thomas Jefferson H S (math 30% / reading 20%, grade F, #1,250 of 1,632 statewide, top 77%, 1,452 students, 97% FRL).
- Market conditions: Rents soft (-1.8%/yr); 176 active listings in the ZIP; 20 comparable units currently listed for rent nearby; rentals lingering (median 46d on market — plan ~5-8 weeks vacancy on turnover, expect pricing pressure); 50% of comp listings sitting > 30 days — soft ceiling on asking rent; high-income renter base; 12,577 units permitted in Dallas County in 2024 (6,829 in 5+ unit buildings).
- Dallas County population projected at +35% by 2050 — long-run rental-demand tailwind backs the buy-and-hold thesis.
- 7 sale attempts since 20y ago with the ask held roughly flat each time — persistent listings suggest the price (not the market) is what's stuck; bring a comps-based counter.
- Climate carrying-cost: major wind risk, 27% chance of damaging wind over 30y; extreme-heat days projected 7→24/yr by 2055 (HVAC capex compounding) — expect insurance premiums to compound above CPI over the hold.
- Cap rate 6.1% vs local median 2.3% in Dallas — top-decile yield for the area; either an underpriced asset or a hidden risk that comps aren't pricing in. Stress-test before assuming the spread holds.
- At $5,480/mo this rent would consume 49% of the median local household income ($135k/yr) (locally 573% of renters already pay >50% of income on rent) — very limited rent-growth headroom before tenants either downsize or default.
Questions for listing agent
- What do current leases actually rent for vs. the listed asking? Can we see a recent rent roll and the last 12 months of T-12 income?
- It's been on market 44 days. Have you received any prior offers? Is the seller open to a 7% concession, seller financing, or rate buy-down credit?
- Is there a deadline driving the sale (1031 exchange, divorce, estate, relocation)? That informs how much negotiation room exists.
- Crime grade is F in this area — have there been break-ins, vandalism, or insurance claims at this property in the last 3 years? What carrier currently insures it and at what premium?
- The area grade is low — what's the realistic commute time and amenity access for the typical tenant pool here? Any planned neighborhood developments (good or bad) we should know about?
- What's the average days-on-market for RENTAL listings here right now (not sales)? A rising rental-DOM trend means longer vacancies and softer asking-rent achievability than the comps imply.
- What's the recent tenant-quality profile in this submarket — average credit score on applications, eviction rate, late-payment / NSF rate, and stable-employment percentage? A property-management company in the area should have these aggregated.
- How much new for-sale + rental construction is in the pipeline within 1–3 miles? Heavy new supply typically softens prices + rents 12–24 months out; constrained supply supports both.
CashFlowRE · CFR-VY255WET2Y1BT9
· Data 3 days ago
cashflowre.app · 2026-05-29