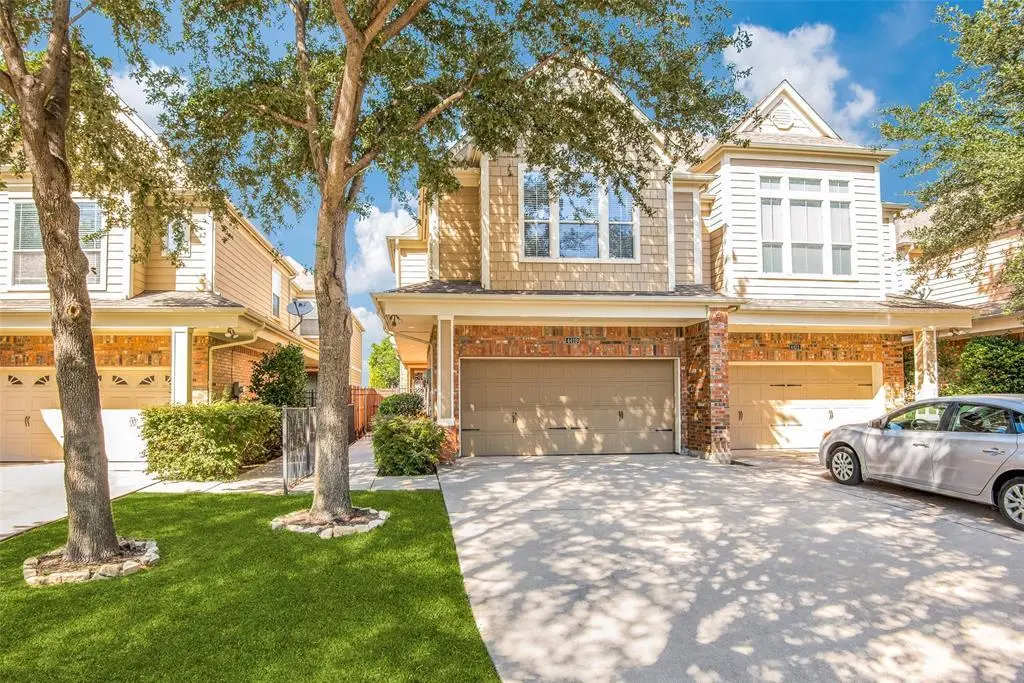
4419 W University Blvd · Dallas, TX
Flood risk 1/10 · Minimal
- FEMA flood zone
- X (unshaded)
- Chance of flooding over 30 yrs
- 0.0%
- Est. flood insurance / yr
- $507 – $1,088
Fire risk 1/10 · Minimal
- Est. fire insurance / yr
- $1,222 – $2,270
Heat risk 7/10 · Major
- Hot days now (above 110°F)
- 7 days/yr
- Hot days in 30 yrs
- 24 days/yr
Wind risk 6/10 · Moderate
- Chance of severe wind over 30 yrs
- 27.0%
Air-quality risk 3/10 · Minor
- Unhealthy air days now
- 2 days/yr
- Unhealthy air days in 30 yrs
- 3 days/yr
Risk factors via First Street. Map © Google.
Why this score? — see what drove the D+ grade
The composite is a weighted blend of 9 inputs, each scored 0–100. Each bar is that input's sub-score; the figure is the points it added to the 100-point composite (weight × sub-score).
- ARV discount +15.0/15.0
- Cash flow +12.2/30.0
- 1% rule +4.3/10.0
- Livability +4.0/5.0
- DSCR +3.6/10.0
- Schools +2.8/10.0
- Condition / age +2.5/5.0
- Rent growth +2.0/5.0
- Appreciation +0.0/10.0
$587,500
🖨 Deal sheet (PDF) 📄 Offer letter ✓ Due diligence
Listing remarks
Beautifully updated single-family attached home in a prime Dallas location with a spacious, functional floor plan designed for everyday living and entertaining. This 3-bedroom, 2.1-bath home features abundant natural light, hardwood floors, an updated kitchen, generously sized bedrooms, and a large backyard with a covered porch perfect for relaxing or hosting guests. The oversized primary suite offers dual sinks, a large walk-in closet, and plenty of space to unwind. Conveniently located near Love Field, the Dallas North Tollway, shopping, dining, and more.
Key facts
- Covered porch
- Dual sinks
- Walk-in closet
Tags
Property features AI
Finance
- HOA & community: No association
Exterior
- Parking: Attached garage facing front; Two covered/garage spaces; Garage approximately 19 feet wide by 19 feet deep
- Utilities: City water; City sewer; Not in a municipal utility district; Energy-efficient appliances
- Home design: Single family residence (residential); Attached property; Two-story home; Built in 2006; Preowned
- Construction: Brick construction
- Exterior features: Balcony; Covered porch(es); Fenced yard with wood and wrought iron fencing; Interior lot; lot dimensions approximately 55 x 165
Interior
- Kitchen: Dishwasher; Gas range; Microwave; Refrigerator; Eat-in kitchen with kitchen island, built-in cabinets, and natural stone/granite counters
- Bedrooms: Three bedrooms total; Primary bedroom located on second floor with dual sinks and walk-in closet(s); Additional bedrooms located on second floor
- Flooring: Carpet; Wood
- Bathrooms: Two full bathrooms; One half bathroom
- Heating & cooling: Central heating (natural gas); Central air; Ceiling fans; Electric cooling components
- Interior features: Cable TV available; Decorative lighting; Two living areas; Two dining areas; Total room count: 7; Two levels
- Laundry & utility: Separate utility room on second floor with built-in cabinets
Neighborhood map
What this means for you Summary
Snapshot
- This is a 3-bed/2.5-bath single-family listed at $588k.
Deal economics
- At list price, monthly cash flow is $-119 ($-1k/yr) — negative.
- To cash-flow at today's rent, offer at most $567k (3.6% below list).
- To meet the 1% rule (rent ≥ 1% of price), the offer needs to be $548k (6.8% below list).
- Recommended offer: $548k (6.8% below list) — sets the bar for 1% rule.
- Cap rate 6.1% vs local median 2.3% in Dallas — top-decile yield for the area; either an underpriced asset or a hidden risk that comps aren't pricing in. Stress-test before assuming the spread holds.
Location & tenants
- Location reads 81/100 on livability (#24 in TX, #1,380 nationally) — a professional / high-income tenant draw. Strengths: amenities A+, commute A+, housing A+; Watch: crime F.
- Dallas ISD (urban): math 31% / reading 36% proficiency, ranked #559 of 826 in TX (top 68%) — families likely to look elsewhere, expect single-tenant / working-renter base with shorter leases; 83% free/reduced lunch — lower-income household profile, screen leases tightly.
- Zoned schools: K B Polk Center For Academically Talented & Gifted (math 22% / reading 22%, grade F, #3,333 of 4,322 statewide, top 80%, 412 students, 82% FRL); D A Hulcy Steam Middle (math 33% / reading 32%, grade F, #947 of 1,662 statewide, top 58%, 423 students, 88% FRL); Thomas Jefferson H S (math 30% / reading 20%, grade F, #1,250 of 1,632 statewide, top 77%, 1,452 students, 97% FRL).
- Market conditions: Rents soft (-1.8%/yr); 176 active listings in the ZIP; 20 comparable units currently listed for rent nearby; rentals lingering (median 46d on market — plan ~5-8 weeks vacancy on turnover, expect pricing pressure); 50% of comp listings sitting > 30 days — soft ceiling on asking rent; high-income renter base; 12,577 units permitted in Dallas County in 2024 (6,829 in 5+ unit buildings).
- At $5,476/mo this rent would consume 49% of the median local household income ($135k/yr) (locally 573% of renters already pay >50% of income on rent) — very limited rent-growth headroom before tenants either downsize or default.
Forward outlook
- Local home prices are declining (-3.0%/yr); year-one equity from $4k of loan paydown is wiped out by about $18k of value loss. Plan a longer hold.
- Dallas County population projected at +35% by 2050 — long-run rental-demand tailwind backs the buy-and-hold thesis.
Negotiation context
- It's been on market 44 days — a 3% lower offer ($570k) is reasonable based on typical stale-listing flexibility.
- 7 sale attempts since 20y ago with the ask held roughly flat each time — persistent listings suggest the price (not the market) is what's stuck; bring a comps-based counter.
Risks & watch-outs
- Climate carrying-cost: major wind risk, 27% chance of damaging wind over 30y; extreme-heat days projected 7→24/yr by 2055 (HVAC capex compounding) — expect insurance premiums to compound above CPI over the hold.
Questions for the listing agent
- What do current leases actually rent for vs. the listed asking? Can we see a recent rent roll and the last 12 months of T-12 income?
- It's been on market 44 days. Have you received any prior offers? Is the seller open to a 7% concession, seller financing, or rate buy-down credit?
- Is there a deadline driving the sale (1031 exchange, divorce, estate, relocation)? That informs how much negotiation room exists.
- Crime grade is F in this area — have there been break-ins, vandalism, or insurance claims at this property in the last 3 years? What carrier currently insures it and at what premium?
- The area grade is low — what's the realistic commute time and amenity access for the typical tenant pool here? Any planned neighborhood developments (good or bad) we should know about?
- What's the average days-on-market for RENTAL listings here right now (not sales)? A rising rental-DOM trend means longer vacancies and softer asking-rent achievability than the comps imply.
- What's the recent tenant-quality profile in this submarket — average credit score on applications, eviction rate, late-payment / NSF rate, and stable-employment percentage? A property-management company in the area should have these aggregated.
- How much new for-sale + rental construction is in the pipeline within 1–3 miles? Heavy new supply typically softens prices + rents 12–24 months out; constrained supply supports both.
Investment metrics
- 1% rule
- 0.93% ✗
- Cap rate
- 6.05%
- Cash-on-cash
- -0.87%
- DSCR
- 0.96
- GRM
- 8.9
CMA / ARV
- ARV (median comp)
- $863,790
- List price
- $587,500
- Delta
- -31.99%
- Verdict
- UNDERPRICED
- Comps
- 20 within 1.0 mi
Show comp detail 12 sales within ~0.75 mi
| Address | Dist | Beds/Ba | Sqft | Sold | Price | $/sf | Match |
|---|---|---|---|---|---|---|---|
| 4518 Hopkins Ave | 0.16mi | 3/2.5 | 2,780 (+4%) | 6mo | $885,000 | $318 | 82 |
| 4516 Hopkins Ave | 0.16mi | 3/2.5 | 2,780 (+4%) | 8mo | $885,000 | $318 | 80 |
| 4527 Hopkins Ave | 0.19mi | 3/2.5 | 2,466 (-8%) | 6mo | $880,000 | $357 | 73 |
| 6822 Victoria Ave | 0.26mi | 4/4.5 (+1) | 2,615 (-3%) | 2mo | $950,000 | $363 | 69 |
| 7603 Culcourt St | 0.38mi | 4/2.5 (+1) | 2,624 (-2%) | 8mo | $850,000 | $324 | 66 |
| 4710 March Ave | 0.19mi | 4/3.5 (+1) | 2,863 (+7%) | 6mo | $1,075,000 | $375 | 66 |
| 7515 Linwood Ave | 0.29mi | 3/2.5 | 2,977 (+11%) | 5mo | $1,395,000 | $469 | 64 |
| 6917 Tyree St | 0.17mi | 4/2.5 (+1) | 2,978 (+11%) | 10mo | $715,500 | $240 | 60 |
| 8204 Ridgelea St | 0.68mi | 4/2.0 (+1) | 2,615 (-3%) | 7mo | $850,000 | $325 | 51 |
| 6529 Victoria | 0.53mi | 4/3.5 (+1) | 2,477 (-8%) | 7mo | $950,000 | $384 | 48 |
| 5325 W University Blvd | 0.71mi | 3/3.5 | 3,005 (+12%) | 1mo | $1,699,000 | $565 | 42 |
| 4722 W Amherst Ave | 0.52mi | 4/4.0 (+1) | 3,007 (+12%) | 11mo | $1,249,000 | $415 | 36 |
Match score weights: distance 35% · size 25% · config 20% · recency 20%. Top-matched comps best support the ARV.
Projected returns pro-forma
-3.0% appreciation · 0.0% rent growth · sell at horizon
- IRR
- -21.4%
- Equity multiple
- 0.28×
- Total profit
- $-118,495
- Equity at exit
- $87,598
- IRR
- -25.6%
- Equity multiple
- -0.06×
- Total profit
- $-173,647
- Equity at exit
- $50,796
Cash invested: $164,500 (down + closing). Projections, not guarantees.
Landlord ↔ Tenant lean methodology
- Overall (STATE)
- 87 Strongly Landlord-Friendly
- State Texas
- 87 Strongly Landlord-Friendly · R+5
- County
- — inherits STATE
- City
- — inherits STATE
ZIP-level market 75209
- Rents YoY
- -1.8%
- Active inventory
- 176
- Price-to-rent
- 8.9×
Monthly cashflow live
- Estimated rent
- $5,476 high interval (Pro) →
- Mortgage (P&I)
- −$3,081
- Tax from tax record
- −$1,119 /mo · $13,427/yr
- Insurance
- −$245
- HOA
- −$0
- Vacancy / Maint / Mgmt
- −$1,150
- Net cashflow
- $-119
Break-even live
Sensitivity live
| Price | -10% $214 | -5% $47 | +0% $-119 | +5% $-285 | +10% $-451 |
|---|---|---|---|---|---|
| Rent | -10% $-551 | -5% $-335 | +0% $-119 | +5% $97 | +10% $314 |
| Rate | -1.0pp $177 | -0.5pp $31 | base $-119 | +0.5pp $-271 | +1.0pp $-426 |
UW: 25.0% down · 7.5% · 30yr · 1.5% tax · 5.0% vac · 8.0% maint · 8.0% mgmt
Financing live
Cash to close
- Down payment
- $146,875
- Closing costs
- $17,625
- Reserves months
- —
- Total cash needed
- —
Loan-product check · same deal, 3 products live
Conventional
25% down · 7.5% · 30yr
- Down + closing
- —
- Monthly P&I
- —
- Monthly cashflow
- —
- DSCR
- —
- Eligible?
- —
Personal DTI + credit; lowest rate.
DSCR
20% down · 8.5% · 30yr
- Down + closing
- —
- Monthly P&I
- —
- Monthly cashflow
- —
- DSCR
- —
- Eligible?
- —
No personal income docs; deal must DSCR.
Hard money
10% down · 12.0% · 12mo
- Down + closing
- —
- Monthly P&I
- —
- Monthly cashflow
- —
- DSCR
- —
- Eligible?
- —
Short-term bridge; refi at stabilization.
Rent comps 20 comps
| Address | Beds | Baths | Sqft | Rent | $/sqft | DOM | Units | Dist |
|---|---|---|---|---|---|---|---|---|
| 4525 W University Blvd Dallas, TX | 3.0 | 2.5 | 2777 | $3,600 | $1.30 | 5d | 1 | 0.11mi |
| 6918 Webster St Dallas, TX | 4.0 | 4.5 | 2596 | $8,000 | $3.08 | 45d | 1 | 0.15mi |
| 4631 March Ave Unit 611 Dallas, TX | 3.0 | 2.0 | 2234 | $4,474 | $2.00 | 0d | 1 | 0.21mi |
| 7519 Taos Rd Dallas, TX | 4.0 | 4.0 | 3222 | $10,500 | $3.26 | 45d | 1 | 0.29mi |
| 4614 Newmore Ave Dallas, TX | 4.0 | 3.0 | 3632 | $15,000 | $4.13 | 45d | 1 | 0.31mi |
| 4903 W University Blvd Dallas, TX | 4.0 | 2.5 | 2450 | $4,500 | $1.84 | 45d | 1 | 0.34mi |
| 4927 Linnet Ln Dallas, TX | 3.0 | 2.5 | 1865 | $5,000 | $2.68 | 9d | 1 | 0.41mi |
| 5126 W Mockingbird Ln Dallas, TX | 3.0 | 2.0 | 1859 | $2,900 | $1.56 | 5d | 1 | 0.82mi |
| 5301 W Mockingbird Ln Dallas, TX | 3.0 | 2.0 | 2250 | $18,000 | $8.00 | 45d | 1 | 0.87mi |
| 3722 Fairfax Ave Dallas, TX | 4.0 | 4.5 | 3748 | $8,000 | $2.13 | 45d | 1 | 1.08mi |
| 3704 W Beverly Dr Dallas, TX | 3.0 | 3.5 | 3101 | $7,000 | $2.26 | 45d | 1 | 1.16mi |
| 3706 W Beverly Dr Dallas, TX | 3.0 | 3.5 | 3101 | $7,000 | $2.26 | 8d | 1 | 1.17mi |
| 3316 Inwood Rd Dallas, TX | 4.0 | 2.5 | 2835 | $4,575 | $1.61 | 20d | 1 | 1.19mi |
| 4449 Mockingbird Ln Dallas, TX | 3.0 | 2.0 | 1980 | $6,500 | $3.28 | 0d | 1 | 1.32mi |
| 9130 Valley Chapel Ln Dallas, TX | 3.0 | 2.5 | 2161 | $5,500 | $2.55 | 9d | 1 | 1.40mi |
| 9207 Esplanade Dr Dallas, TX | 2.0 | 2.5 | 2508 | $4,700 | $1.87 | 45d | 1 | 1.44mi |
| 3111 Hedgerow Dr Dallas, TX | 4.0 | 3.0 | 3482 | $15,000 | $4.31 | 45d | 1 | 1.44mi |
| 3900 W Northwest Hwy Dallas, TX | 3.0 | 1.0–2.5 | 1334 | $4,155 | $3.11 | 1d | 28 | 1.46mi |
| 7207 Mohawk Dr Unit 106 Dallas, TX | 2.0 | 2.5 | 1755 | $2,850 | $1.62 | 6d | 1 | 1.47mi |
| 7207 Mohawk Dr Unit B 3 Dallas, TX | 2.0 | 2.5 | 2000 | $2,950 | $1.48 | 45d | 1 | 1.47mi |
Listing history 30 events
-
2026-06-15statusdays on market $587,500 Pending 44 DOM
-
2026-06-13statusdays on market $587,500 Active Option Contract 43 DOM
-
2026-06-09days on market $587,500 Active 39 DOM
-
2026-06-08days on market $587,500 Active 38 DOM
-
2026-06-07days on market $587,500 Active 37 DOM
-
2026-06-04days on market $587,500 Active 34 DOM
-
2026-06-03days on market $587,500 Active 33 DOM
-
2026-06-02days on market $587,500 Active 32 DOM
-
2026-06-01days on market $587,500 Active 31 DOM
-
2026-05-31days on market $587,500 Active 30 DOM
-
2026-05-12status Active 563-char remark
-
2026-05-09historical Active Option Contract 563-char remark
-
2026-05-01$587,500 Active 563-char remark
-
2026-04-29historical
-
2026-04-16price $589,000
-
2026-02-07price $595,000
-
2025-09-23$599,000 Active
-
2020-01-28historical
-
2019-12-17$440,000 Active
-
2016-10-04soldstatus
-
2016-09-30soldstatus Sold
-
2016-09-12status Pending
-
2016-08-24historical Active Contingent
-
2016-08-18$400,000 Active
-
2011-02-11historical
-
2010-10-05$334,900 Active
-
2007-03-05soldstatus
-
2007-01-29historical
-
2006-09-19$340,900
-
1995-03-14soldstatus
ⓘ Source: listings_history table (triggers on properties + properties_extension) + one-shot
backfill from property_details.listing_events for pre-trigger history.
Tax reassessment forecast TX · Resets to sale price
- Current annual tax
- $13,427 · $1,119/mo
- Projected year-2 tax
- $13,427 · $1,119/mo
- Expected delta
- $0/yr ($0/mo · 0.0%)
ⓘ Screening estimate from a state-policy table — verify with the county assessor before closing.
Climate risk First Street
- Flood 1/10 Low FEMA zone X (unshaded) · 0% chance over 30 yrs
- Wildfire 1/10 Low
- Heat 7/10 Severe 7 d/yr ≥110°F today · 24 d/yr by 30 yrs out
- Wind 6/10 Major 27% chance of damaging wind over 30 yrs
- Air quality 3/10 Moderate 2 unhealthy d/yr today · 3 by 30 yrs out
Nearby sold comps map
Loading sold comps map…
Walkable amenities ~0.75 mi
Loading nearby amenities…
Taxation est. · year 1
- Rental income
- $65,709
- − Mortgage interest
- −$32,909
- − Property taxes
- −$13,427
- − Insurance
- −$2,938
- − Repairs & maintenance
- −$5,257
- − Management
- −$5,257
- − Depreciation
- −$17,091
- Taxable loss
- −$11,169
- Est. tax savings @ 24.0%
- +$2,681
- After-tax cash flow
- $1,255/yr
For passive investors: Depreciation is non-cash, so a rental often shows a tax loss while cash-flowing — sheltering income. Rental losses are passive: they offset passive income freely, and up to $25,000/yr can offset ordinary (W-2) income if you actively participate and your MAGI is under $100k (phasing out to $0 by $150k); unused losses carry forward. On sale, claimed depreciation is recaptured at up to 25%, and gains may owe capital-gains tax (a 1031 exchange can defer both). Figures are a year-1 estimate at your 24.0% rate — not tax advice; consult a CPA.
Schools (NCES district)
- District
- Dallas ISD
- NCES district ID
- 4816230
- Math proficiency
- 31% ▼ -16.00%
- Reading proficiency
- 36% ▼ -4.00%
- Median HH income
- $42,881
- Composite
- 28.41/100
- National rank
- #6763
- State rank
- #559 of 826 in TX
Livability — Dallas
- Score
- 81/100
- State rank
- #24
- US rank
- #1380
Category grades
Schools grade is shown separately in the Schools card above.
Census & demographics
- Census place
- Dallas, TX
- County
- Dallas County · 2,612,404 people
- City population
- 1,168,437
- Metro
- Dallas-Fort Worth-Arlington, TX
- Population (ZIP)
- 14,211
- Household income
- $134,707
- Rent vs Own
- Severe rent burden
- 573.0
Population outlook (Dallas County) Hauer SSP2
- Today (2025)
- 2,979,839 people
- By 2030
- 3,191,823 · +7.1%
- By 2040
- 3,619,611 · +21.5%
- By 2050
- 4,026,915 · +35.1%
- By 2075
- 4,957,073 · +66.4%
- By 2100
- 5,508,725 · +84.9%
Race, ethnicity, and origin ACS 2023
- Neighborhood character
- Predominantly White (66%)
- Race & ethnicity
- White 66% Hispanic / Latino 15% Black 12% Two or more races 8% Asian 4%
- Hispanic origin (detail)
- Mexican 8%
- Common ancestry
- Lithuanian 5% Italian 3% Slovak 3%
- Foreign-born
- 11% · Canada, Vietnam, Jamaica
- Languages at home
- 81% English-only · Spanish 12% Other Indo-European 3% Vietnamese 1%
Political lean MEDSL · Dallas
- 2024 margin
- Strong D (+22.2) · D 60.2% · R 38.0% · Other 1.8%
- 2008→2024 swing
- +6.9pp toward D · 2008: 15.3pp · 2024: 22.2pp
- All cycles
- 2024: D+22.2 2020: D+31.6 2016: D+26.2 2012: D+15.4 2008: D+15.3
Not yet ingested
- Civics
- —
Market trends
- HPI YoY
- ▼ -922.58%
- Current HPI
- 316.5276
- Rent YoY
- ▼ -1.82%
- Metro
- Dallas-Fort Worth-Arlington, TX
- State GDP YoY
- ▲ 3.95%
- F500 in state
- 110
Industry mix (Fortune 500 HQ in TX)
| Industry | F500 HQs | Revenue |
|---|---|---|
| Energy | 16 | $1,198B |
|
||
| Technology | 5 | $198B |
|
||
| Engineering / Construction | 4 | $72B |
|
||
| Energy Services | 3 | $60B |
|
||
| Utilities | 3 | $41B |
|
||
| Healthcare | 2 | $330B |
|
||
Price history
+72.3% since first listed22 events — show timeline
- 2026-06-15 Pending — NTREIS
- 2026-06-11 Contingent — NTREIS
- 2026-05-12 Relisted — NTREIS
- 2026-05-09 Contingent — NTREIS
- 2026-05-01 Listed $587,500 NTREIS
- 2026-04-29 Listing Removed — NTREIS
- 2026-04-16 Price Changed $589,000 NTREIS
- 2026-02-07 Price Changed $595,000 NTREIS
- 2025-09-23 Listed $599,000 NTREIS
- 2020-01-28 Listing Removed — NTREIS
- 2019-12-17 Listed $440,000 NTREIS
- 2016-10-04 Sold (Public Records) — Public Records
- 2016-09-30 Sold (MLS) — NTREIS
- 2016-09-12 Pending — NTREIS
- 2016-08-24 Contingent — NTREIS
- 2016-08-18 Listed $400,000 NTREIS
- 2011-02-11 Listing Removed — NTREIS
- 2010-10-05 Listed $334,900 NTREIS
- 2007-03-05 Sold (MLS) — NTREIS
- 2007-01-29 Listing Removed — NTREIS
- 2006-09-19 Listed $340,900 NTREIS
- 1995-03-14 Sold (Public Records) — Public Records
Property tax history
+2.8%/yrLatest (2025): $13,427 · -5.0% YoY. Source: county tax records.
Cash-flow waterfall
monthlySold comps — $/sqft
last 12 mo · ≤1 miLoading sold comps…