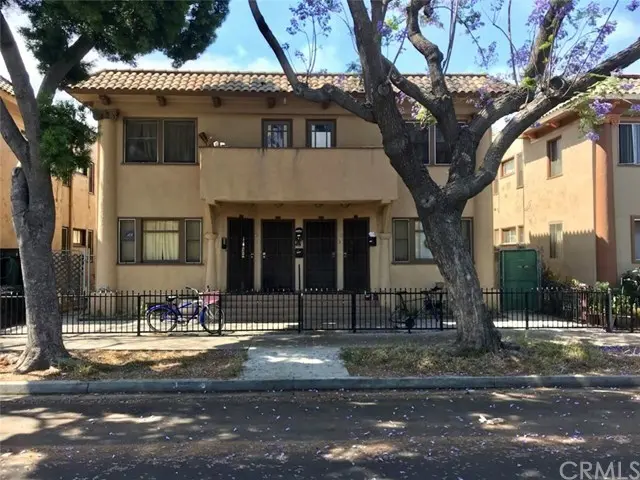
508 W 10th
Long Beach, CA 90813
$900,000C-
4 bd · 4.0 ba ·
3,328 sqft ·
Built 1921
· MultiFamily
· Active
· 17 DOM
Cashflow @ list (25.0% down · 7.5%)
Estimated rent
$8,624/mo
Mortgage (P&I)
−$4,720
Tax + insurance
−$1,633
HOA
−$0
Vac / Maint / Mgmt
−$1,811
Net cashflow
$460/mo
Annual
$5,523/yr
Cap rate
6.91%
Cash-on-cash
2.19%
DSCR
1.10
1% rule
0.96%
Cash to close
$252,000
Investor read
- This is a 3×2bd/1ba + 1×3bd/1ba units multifamily listed at $900k.
- At list price, monthly cash flow is $460 ($6k/yr) — positive. Per door: $115/mo.
- The deal already cash-flows at list — no discount required.
- To meet the 1% rule (rent ≥ 1% of price), the offer needs to be $862k (4.2% below list).
- It's been on market 17 days — a 2% lower offer ($886k) is reasonable based on typical stale-listing flexibility.
- Recommended offer: $862k (4.2% below list) — sets the bar for 1% rule.
- Local home prices are declining (-3.0%/yr); year-one equity from $6k of loan paydown is wiped out by about $27k of value loss. Plan a longer hold.
- Location reads 67/100 on livability (#319 in CA) — a middle-class / working-renter tenant base. Strengths: amenities A+, commute A+, employment B+; Watch: health & safety C-, crime F, cost of living F.
- Long Beach Unified (urban): math 34% / reading 50% proficiency, ranked #216 of 517 in CA (top 42%) — families likely to look elsewhere, expect single-tenant / working-renter base with shorter leases.
- Watch-outs: built in 1921 — expect roof / HVAC / electrical / plumbing capex.
- Market conditions: Rents soft (-0.3%/yr); 82 active listings in the ZIP; 1 comparable units currently listed for rent nearby; 19,697 units permitted in Los Angeles County in 2024 (9,426 in 5+ unit buildings).
- Los Angeles County population projected at +9% by 2050 — modest demand growth; plan on rents tracking national, not racing it.
- 15 sale attempts since 27y ago; this cycle's ask has dropped $149k (14%) from the opening price — seller is motivated, your offer sets the floor, not the list.
- Cap rate 6.9% vs local median 1.9% in Long Beach — top-decile yield for the area; either an underpriced asset or a hidden risk that comps aren't pricing in. Stress-test before assuming the spread holds.
- At $8,624/mo this rent would consume 190% of the median local household income ($55k/yr) (locally 4941% of renters already pay >50% of income on rent) — very limited rent-growth headroom before tenants either downsize or default.
Questions for listing agent
- Can we see the unit-by-unit rent roll, current vacancy, and any below-market leases? What's the average tenancy length?
- What capital expenditures (roof, boiler, parking lot, exteriors) have been made in the last 5 years, and what's planned in the next 2?
- Built in 1921 — when were the roof, HVAC, electrical panel, plumbing, and water heater last replaced?
- Is there a deadline driving the sale (1031 exchange, divorce, estate, relocation)? That informs how much negotiation room exists.
- Crime grade is F in this area — have there been break-ins, vandalism, or insurance claims at this property in the last 3 years? What carrier currently insures it and at what premium?
- What's the average days-on-market for RENTAL listings here right now (not sales)? A rising rental-DOM trend means longer vacancies and softer asking-rent achievability than the comps imply.
- What's the recent tenant-quality profile in this submarket — average credit score on applications, eviction rate, late-payment / NSF rate, and stable-employment percentage? A property-management company in the area should have these aggregated.
- How much new apartment / multifamily construction is in the pipeline within 1–3 miles? Heavy new supply (>2% of stock underway) typically softens rents 12–24 months out; light construction supports rent growth.
CashFlowRE · CFR-VYP69N8Z3GSQ3G
· Data 2 days ago
cashflowre.app · 2026-05-29