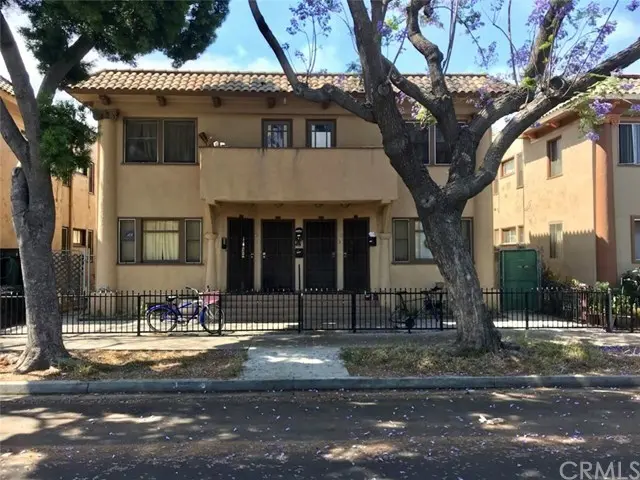
 Fourplex
508 W 10th · Long Beach, CA
Flood risk 1/10 · Minimal
- FEMA flood zone
- X (unshaded)
- Chance of flooding over 30 yrs
- 0.0%
- Est. flood insurance / yr
- $507 – $1,088
Fire risk 1/10 · Minimal
- Est. fire insurance / yr
- $659 – $1,223
Heat risk 4/10 · Minor
- Hot days now (above 88°F)
- 7 days/yr
- Hot days in 30 yrs
- 23 days/yr
Wind risk 1/10 · Minimal
- Chance of severe wind over 30 yrs
- —
Air-quality risk 6/10 · Moderate
- Unhealthy air days now
- 9 days/yr
- Unhealthy air days in 30 yrs
- 10 days/yr
Risk factors via First Street. Map © Google.
Why this score? — see what drove the C- grade
The composite is a weighted blend of 9 inputs, each scored 0–100. Each bar is that input's sub-score; the figure is the points it added to the 100-point composite (weight × sub-score).
- Cash flow +16.1/30.0
- ARV discount +15.0/15.0
- DSCR +5.0/10.0
- 1% rule +4.6/10.0
- Schools +3.7/10.0
- Livability +3.4/5.0
- Condition / age +2.5/5.0
- Rent growth +2.4/5.0
- Appreciation +0.0/10.0
$900,000
🖨 Deal sheet 📄 Offer letter ✓ Due diligence
Multi-family units
County records classify this as Multi-Family (2-4 Unit). Listing-text estimate: 4 units. confirmed
Listing remarks MLS
PRIME 4-PLEX OPPORTUNITY IN DOWNTOWN LONG BEACH. 4 UNITS CONSISTING OF 3- 2BEDROOM/1BATH AND 1- 3BEDROOM/1BATH. THE WHOLE BUILDING HAD A MAJOR REMODEL 7 YEARS AGO WITH NEW COPPER PLUMBING, NEW ROOF, NEW ELECTRICAL, AND MUCH MORE! EACH UNIT IS SEPARATELY METERED FOR GAS & ELECTRIC. TENANTS PAY ALL UTILITIES AND MAINTENANCE. SELLER PAYS TAXES & INSURANCE ONLY FOR THIS PROPERTY. RENTS HAVE NOT BEEN RAISED IN YEARS. MONTH - MONTH TENANTS. TONS OF UPSIDE. HURRY THIS PROPERTY WILL NOT LAST LONG!
Key facts
- Prime quadruplex
- Vacant property
- Flexible layout
Tags
Neighborhood map
What this means for you Summary
Snapshot
- This is a 3×2bd/1ba + 1×3bd/1ba units multifamily listed at $900k.
Deal economics
- At list price, monthly cash flow is $460 ($6k/yr) — positive. Per door: $115/mo.
- The deal already cash-flows at list — no discount required.
- To meet the 1% rule (rent ≥ 1% of price), the offer needs to be $862k (4.2% below list).
- Recommended offer: $862k (4.2% below list) — sets the bar for 1% rule.
- Cap rate 6.9% vs local median 1.9% in Long Beach — top-decile yield for the area; either an underpriced asset or a hidden risk that comps aren't pricing in. Stress-test before assuming the spread holds.
Location & tenants
- Location reads 67/100 on livability (#319 in CA) — a middle-class / working-renter tenant base. Strengths: amenities A+, commute A+, employment B+; Watch: health & safety C-, crime F, cost of living F.
- Long Beach Unified (urban): math 34% / reading 50% proficiency, ranked #216 of 517 in CA (top 42%) — families likely to look elsewhere, expect single-tenant / working-renter base with shorter leases.
- Market conditions: Rents soft (-0.3%/yr); 82 active listings in the ZIP; 1 comparable units currently listed for rent nearby; 19,697 units permitted in Los Angeles County in 2024 (9,426 in 5+ unit buildings).
- At $8,624/mo this rent would consume 190% of the median local household income ($55k/yr) (locally 4941% of renters already pay >50% of income on rent) — very limited rent-growth headroom before tenants either downsize or default.
Forward outlook
- Local home prices are declining (-3.0%/yr); year-one equity from $6k of loan paydown is wiped out by about $27k of value loss. Plan a longer hold.
- Los Angeles County population projected at +9% by 2050 — modest demand growth; plan on rents tracking national, not racing it.
Negotiation context
- It's been on market 17 days — a 2% lower offer ($886k) is reasonable based on typical stale-listing flexibility.
- 15 sale attempts since 27y ago; this cycle's ask has dropped $149k (14%) from the opening price — seller is motivated, your offer sets the floor, not the list.
Risks & watch-outs
- Watch-outs: built in 1921 — expect roof / HVAC / electrical / plumbing capex.
Questions for the listing agent
- Can we see the unit-by-unit rent roll, current vacancy, and any below-market leases? What's the average tenancy length?
- What capital expenditures (roof, boiler, parking lot, exteriors) have been made in the last 5 years, and what's planned in the next 2?
- Built in 1921 — when were the roof, HVAC, electrical panel, plumbing, and water heater last replaced?
- Is there a deadline driving the sale (1031 exchange, divorce, estate, relocation)? That informs how much negotiation room exists.
- Crime grade is F in this area — have there been break-ins, vandalism, or insurance claims at this property in the last 3 years? What carrier currently insures it and at what premium?
- What's the average days-on-market for RENTAL listings here right now (not sales)? A rising rental-DOM trend means longer vacancies and softer asking-rent achievability than the comps imply.
- What's the recent tenant-quality profile in this submarket — average credit score on applications, eviction rate, late-payment / NSF rate, and stable-employment percentage? A property-management company in the area should have these aggregated.
- How much new apartment / multifamily construction is in the pipeline within 1–3 miles? Heavy new supply (>2% of stock underway) typically softens rents 12–24 months out; light construction supports rent growth.
Investment metrics
- 1% rule
- 0.96% ✗
- Cap rate
- 6.91%
- Cash-on-cash
- 2.19%
- DSCR
- 1.10
- GRM
- 8.7
CMA / ARV
- ARV (median comp)
- $1,117,011
- List price
- $900,000
- Delta
- 2.51%
- Verdict
- FAIR
- Comps
- 20 within 1.0 mi
Projected returns pro-forma
-3.0% appreciation · 0.0% rent growth · sell at horizon
- IRR
- -16.3%
- Equity multiple
- 0.44×
- Total profit
- $-141,586
- Equity at exit
- $134,193
- IRR
- -14.7%
- Equity multiple
- 0.28×
- Total profit
- $-182,354
- Equity at exit
- $77,816
Cash invested: $252,000 (down + closing). Projections, not guarantees.
Landlord ↔ Tenant lean methodology
- Overall (STATE)
- 18 Strongly Tenant-Friendly
- State California
- 18 Strongly Tenant-Friendly · D+13
- County
- — inherits STATE
- City
- — inherits STATE
ZIP-level market 90813
- Rents YoY
- -0.3%
- Active inventory
- 82
- Price-to-rent
- 36.1×
Monthly cashflow live
- Estimated rent
- $8,624 high interval (Pro) →
- Mortgage (P&I)
- −$4,720
- Tax from tax record
- −$1,258 /mo · $15,096/yr
- Insurance
- −$375
- HOA
- −$0
- Vacancy / Maint / Mgmt
- −$1,811
- Net cashflow
- $460
Break-even live
4-unit breakdown (identical units grouped — click to expand)
| Units | Beds | Baths | Est. rent |
|---|---|---|---|
| 3× units | 2 | 1 | $6,228 |
| #1 | 2 | 1 | $2,076 |
| #2 | 2 | 1 | $2,076 |
| #3 | 2 | 1 | $2,076 |
| 1× unit | 3 | 1 | $2,396 |
| Total (4 units) | $8,624 | ||
UW: 25.0% down · 7.5% · 30yr · 1.5% tax · 5.0% vac · 8.0% maint · 8.0% mgmt
Financing live
Cash to close
- Down payment
- $225,000
- Closing costs
- $27,000
- Reserves months
- —
- Total cash needed
- —
Loan-product check · same deal, 3 products live
Conventional
25% down · 7.5% · 30yr
- Down + closing
- —
- Monthly P&I
- —
- Monthly cashflow
- —
- DSCR
- —
- Eligible?
- —
Personal DTI + credit; lowest rate.
DSCR
20% down · 8.5% · 30yr
- Down + closing
- —
- Monthly P&I
- —
- Monthly cashflow
- —
- DSCR
- —
- Eligible?
- —
No personal income docs; deal must DSCR.
Hard money
10% down · 12.0% · 12mo
- Down + closing
- —
- Monthly P&I
- —
- Monthly cashflow
- —
- DSCR
- —
- Eligible?
- —
Short-term bridge; refi at stabilization.
Rent comps 1 comps
| Address | Beds | Baths | Sqft | Rent | $/sqft | DOM | Units | Dist |
|---|---|---|---|---|---|---|---|---|
| 500 W Broadway Long Beach, CA | 3.0 | 1.0–3.0 | 1677 | $3,604 | $2.15 | 2d | 13 | 0.69mi |
Listing history 50 events
-
2026-06-18days on market $900,000 Active 17 DOM
-
2026-06-17days on market $900,000 Active 16 DOM
-
2026-06-16days on market $900,000 Active 15 DOM
-
2026-06-15days on market $900,000 Active 14 DOM
-
2026-06-13days on market $900,000 Active 12 DOM
-
2026-06-13days on market $900,000 Active 11 DOM
-
2026-06-09days on market $900,000 Active 8 DOM
-
2026-06-08days on market $900,000 Active 7 DOM
-
2026-06-07days on market $900,000 Active 6 DOM
-
2026-06-04days on market $900,000 Active 3 DOM
-
2026-06-03days on market $900,000 Active 2 DOM
-
2026-06-02remarks 693-char remark
-
2026-06-02pricestatusdays on market $900,000 Active 1 DOM
-
2026-04-23price
-
2026-02-13price
-
2026-02-01price
-
2025-11-18Active
-
2019-07-29soldstatus $1,020,000 502-char remark
Show marketing remark (502 chars)
PRIME 4-PLEX OPPORTUNITY IN DOWNTOWN LONG BEACH. 4 UNITS CONSISTING OF 3- 2BEDROOM/1BATH AND 1- 3BEDROOM/1BATH. THE WHOLE BUILDING HAD A MAJOR REMODEL 7 YEARS AGO WITH NEW COPPER PLUMBING, NEW ROOF, NEW ELECTRICAL, AND MUCH MORE! EACH UNIT IS SEPARATELY METERED FOR GAS & ELECTRIC. TENANTS PAY ALL UTILITIES AND MAINTENANCE. SELLER PAYS TAXES & INSURANCE ONLY FOR THIS PROPERTY. RENTS HAVE NOT BEEN RAISED IN YEARS. MONTH - MONTH TENANTS. TONS OF UPSIDE. HURRY THIS PROPERTY WILL NOT LAST LONG!
-
2019-07-29soldstatus $1,020,000 Closed Sale
Show marketing remark (502 chars)
PRIME 4-PLEX OPPORTUNITY IN DOWNTOWN LONG BEACH. 4 UNITS CONSISTING OF 3- 2BEDROOM/1BATH AND 1- 3BEDROOM/1BATH. THE WHOLE BUILDING HAD A MAJOR REMODEL 7 YEARS AGO WITH NEW COPPER PLUMBING, NEW ROOF, NEW ELECTRICAL, AND MUCH MORE! EACH UNIT IS SEPARATELY METERED FOR GAS & ELECTRIC. TENANTS PAY ALL UTILITIES AND MAINTENANCE. SELLER PAYS TAXES & INSURANCE ONLY FOR THIS PROPERTY. RENTS HAVE NOT BEEN RAISED IN YEARS. MONTH - MONTH TENANTS. TONS OF UPSIDE. HURRY THIS PROPERTY WILL NOT LAST LONG!
-
2019-07-29soldstatus $1,020,000
Show marketing remark (502 chars)
PRIME 4-PLEX OPPORTUNITY IN DOWNTOWN LONG BEACH. 4 UNITS CONSISTING OF 3- 2BEDROOM/1BATH AND 1- 3BEDROOM/1BATH. THE WHOLE BUILDING HAD A MAJOR REMODEL 7 YEARS AGO WITH NEW COPPER PLUMBING, NEW ROOF, NEW ELECTRICAL, AND MUCH MORE! EACH UNIT IS SEPARATELY METERED FOR GAS & ELECTRIC. TENANTS PAY ALL UTILITIES AND MAINTENANCE. SELLER PAYS TAXES & INSURANCE ONLY FOR THIS PROPERTY. RENTS HAVE NOT BEEN RAISED IN YEARS. MONTH - MONTH TENANTS. TONS OF UPSIDE. HURRY THIS PROPERTY WILL NOT LAST LONG!
-
2019-06-28status Pending Sale
-
2019-06-14$1,049,000 502-char remark
Show marketing remark (502 chars)
PRIME 4-PLEX OPPORTUNITY IN DOWNTOWN LONG BEACH. 4 UNITS CONSISTING OF 3- 2BEDROOM/1BATH AND 1- 3BEDROOM/1BATH. THE WHOLE BUILDING HAD A MAJOR REMODEL 7 YEARS AGO WITH NEW COPPER PLUMBING, NEW ROOF, NEW ELECTRICAL, AND MUCH MORE! EACH UNIT IS SEPARATELY METERED FOR GAS & ELECTRIC. TENANTS PAY ALL UTILITIES AND MAINTENANCE. SELLER PAYS TAXES & INSURANCE ONLY FOR THIS PROPERTY. RENTS HAVE NOT BEEN RAISED IN YEARS. MONTH - MONTH TENANTS. TONS OF UPSIDE. HURRY THIS PROPERTY WILL NOT LAST LONG!
-
2019-06-14$1,049,000 Active
Show marketing remark (502 chars)
PRIME 4-PLEX OPPORTUNITY IN DOWNTOWN LONG BEACH. 4 UNITS CONSISTING OF 3- 2BEDROOM/1BATH AND 1- 3BEDROOM/1BATH. THE WHOLE BUILDING HAD A MAJOR REMODEL 7 YEARS AGO WITH NEW COPPER PLUMBING, NEW ROOF, NEW ELECTRICAL, AND MUCH MORE! EACH UNIT IS SEPARATELY METERED FOR GAS & ELECTRIC. TENANTS PAY ALL UTILITIES AND MAINTENANCE. SELLER PAYS TAXES & INSURANCE ONLY FOR THIS PROPERTY. RENTS HAVE NOT BEEN RAISED IN YEARS. MONTH - MONTH TENANTS. TONS OF UPSIDE. HURRY THIS PROPERTY WILL NOT LAST LONG!
-
2017-06-07soldstatus $760,000 Closed Sale
-
2017-06-07soldstatus $760,000
-
2017-06-07soldstatus $760,000
-
2017-04-29status Pending Sale
-
2017-04-24$799,000 Active
-
2017-04-24$799,000
-
2011-06-23soldstatus $330,000 Closed
-
2011-05-13status Pending
-
2011-02-18$385,900 Active
-
2011-02-17soldstatus $330,000 Closed
-
2011-02-16$385,900 Active
-
2008-02-05historical
-
2007-11-07$820,000
-
2007-09-21historical
-
2007-06-20$840,000
-
2004-09-14soldstatus $650,000
-
2004-09-02soldstatus $650,000
-
2004-06-01$650,000
-
2002-03-13historical
-
2001-12-31historical
-
2001-12-17soldstatus $320,000
-
2001-12-08$320,000
-
2001-12-05historical
-
2001-09-13
-
2001-09-13$301,900
-
2001-06-26soldstatus $175,000
-
2001-05-30historical
ⓘ Source: listings_history table (triggers on properties + properties_extension) + one-shot
backfill from property_details.listing_events for pre-trigger history.
Tax reassessment forecast CA · Resets to sale price
- Current annual tax
- $15,096 · $1,258/mo
- Projected year-2 tax
- $15,096 · $1,258/mo
- Expected delta
- $0/yr ($0/mo · -0.0%)
ⓘ Screening estimate from a state-policy table — verify with the county assessor before closing.
Climate risk First Street
- Flood 1/10 Low FEMA zone X (unshaded) · 0% chance over 30 yrs
- Wildfire 1/10 Low
- Heat 4/10 Moderate 7 d/yr ≥88°F today · 23 d/yr by 30 yrs out
- Wind 1/10 Low
- Air quality 6/10 Major 9 unhealthy d/yr today · 10 by 30 yrs out
Nearby sold comps map
Loading sold comps map…
Walkable amenities ~0.75 mi
Loading nearby amenities…
Taxation est. · year 1
- Rental income
- $103,488
- − Mortgage interest
- −$50,414
- − Property taxes
- −$15,096
- − Insurance
- −$4,500
- − Repairs & maintenance
- −$8,279
- − Management
- −$8,279
- − Depreciation
- −$26,182
- Taxable loss
- −$9,262
- Est. tax savings @ 24.0%
- +$2,223
- After-tax cash flow
- $7,746/yr
For passive investors: Depreciation is non-cash, so a rental often shows a tax loss while cash-flowing — sheltering income. Rental losses are passive: they offset passive income freely, and up to $25,000/yr can offset ordinary (W-2) income if you actively participate and your MAGI is under $100k (phasing out to $0 by $150k); unused losses carry forward. On sale, claimed depreciation is recaptured at up to 25%, and gains may owe capital-gains tax (a 1031 exchange can defer both). Figures are a year-1 estimate at your 24.0% rate — not tax advice; consult a CPA.
Schools (NCES district)
- District
- Long Beach Unified
- NCES district ID
- 0622500
- Math proficiency
- 34% ▼ -11.00%
- Reading proficiency
- 50% ▼ -4.00%
- Median HH income
- $56,092
- Composite
- 36.67/100
- National rank
- #4607
- State rank
- #216 of 517 in CA
Livability — Long Beach
- Score
- 67/100
- State rank
- #319
- US rank
- #10758
Category grades
Schools grade is shown separately in the Schools card above.
Census & demographics
- Census place
- Long Beach, CA
- County
- Los Angeles County · 9,444,647 people
- City population
- 466,088
- Metro
- Los Angeles-Long Beach-Anaheim, CA
- Population (ZIP)
- 51,241
- Household income
- $54,526
- Rent vs Own
- Severe rent burden
- 4941.0
Population outlook (Los Angeles County) Hauer SSP2
- Today (2025)
- 10,940,515 people
- By 2030
- 11,256,481 · +2.9%
- By 2040
- 11,729,929 · +7.2%
- By 2050
- 11,948,407 · +9.2%
- By 2075
- 11,818,114 · +8.0%
- By 2100
- 10,842,928 · -0.9%
Race, ethnicity, and origin ACS 2023
- Neighborhood character
- Diverse neighborhood (Simpson 0.55)
- Race & ethnicity
- Hispanic / Latino 64% Two or more races 13% Asian 12% Black 11% White 9% Native American 2%
- Hispanic origin (detail)
- Mexican 53%
- Common ancestry
- Lithuanian 1% Serbian 1%
- Foreign-born
- 36% · Canada, South Korea, Vietnam
- Languages at home
- 33% English-only · Spanish 56% Other Asian/Pacific 6% Tagalog/Filipino 1%
Political lean MEDSL · Los Angeles
- 2024 margin
- Solid D (+32.9) · D 64.8% · R 31.9% · Other 3.3%
- 2008→2024 swing
- -7.4pp toward R · 2008: 40.4pp · 2024: 32.9pp
- All cycles
- 2024: D+32.9 2020: D+44.2 2016: D+48.0 2012: D+40.0 2008: D+40.4
Not yet ingested
- Civics
- —
Market trends
- HPI YoY
- ▼ -468.88%
- Current HPI
- 480.8118
- Rent YoY
- ▼ -0.34%
- Metro
- Los Angeles-Long Beach-Anaheim, CA
- State GDP YoY
- ▲ 3.21%
- F500 in state
- 116
Industry mix (Fortune 500 HQ in CA)
| Industry | F500 HQs | Revenue |
|---|---|---|
| Technology | 27 | $1,492B |
|
||
| Financial Services | 3 | $174B |
|
||
| Retail | 3 | $44B |
|
||
| Insurance | 3 | $26B |
|
||
| Media / Entertainment | 2 | $115B |
|
||
| Pharmaceuticals / Biotech | 2 | $62B |
|
||
Price history
+518.2% since first listed45 events — show timeline
- 2026-04-23 Price Changed — TheMLS
- 2026-02-13 Price Changed — TheMLS
- 2026-02-01 Price Changed — TheMLS
- 2025-11-18 Listed — TheMLS
- 2019-07-29 Sold (Public Records) $1,020,000 Public Records
- 2019-07-29 Sold (MLS) $1,020,000 CRMLS
- 2019-07-29 Sold (MLS) $1,020,000 SDMLS
- 2019-06-28 Pending — CRMLS
- 2019-06-14 Listed $1,049,000 CRMLS
- 2019-06-14 Listed $1,049,000 SDMLS
- 2017-06-07 Sold (Public Records) $760,000 Public Records
- 2017-06-07 Sold (MLS) $760,000 SDMLS
- 2017-06-07 Sold (MLS) $760,000 CRMLS
- 2017-04-29 Pending — CRMLS
- 2017-04-24 Listed $799,000 CRMLS
- 2017-04-24 Listed $799,000 SDMLS
- 2011-06-23 Sold (MLS) $330,000 CRMLS
- 2011-05-13 Pending — CRMLS
- 2011-02-18 Listed $385,900 CRMLS
- 2011-02-17 Sold (MLS) $330,000 CRMLS
- 2011-02-16 Listed $385,900 CRMLS
- 2008-02-05 Listing Removed — CRMLS
- 2007-11-07 Listed $820,000 CRMLS
- 2007-09-21 Listing Removed — CRMLS
- 2007-06-20 Listed $840,000 CRMLS
- 2004-09-14 Sold (MLS) $650,000 CRMLS
- 2004-09-02 Sold (Public Records) $650,000 Public Records
- 2004-06-01 Listed $650,000 CRMLS
- 2002-03-13 Listing Removed — CRMLS
- 2001-12-31 Listing Removed — CRMLS
- 2001-12-17 Sold (Public Records) $320,000 Public Records
- 2001-12-08 Listed $320,000 CRMLS
- 2001-12-05 Delisted — TheMLS
- 2001-09-13 Listed $301,900 CRMLS
- 2001-09-13 Listed — TheMLS
- 2001-06-26 Sold (Public Records) $175,000 Public Records
- 2001-05-30 Listing Removed — CRMLS
- 2000-12-15 Listed $174,900 CRMLS
- 1999-10-25 Sold (Public Records) $295,000 Public Records
- 1999-08-18 Sold (MLS) $295,000 CRMLS
- 1999-06-17 Listed $295,000 CRMLS
- 1999-03-04 Sold (Public Records) $160,000 Public Records
- 1993-05-27 Sold (Public Records) $133,000 Public Records
- 1990-01-31 Sold (Public Records) $250,000 Public Records
- 1986-12-17 Sold (Public Records) $165,000 Public Records
Property tax history
+3.9%/yrLatest (2025): $15,096 · +4.5% YoY. Source: county tax records.
Cash-flow waterfall
monthlySold comps — $/sqft
last 12 mo · ≤1 miLoading sold comps…