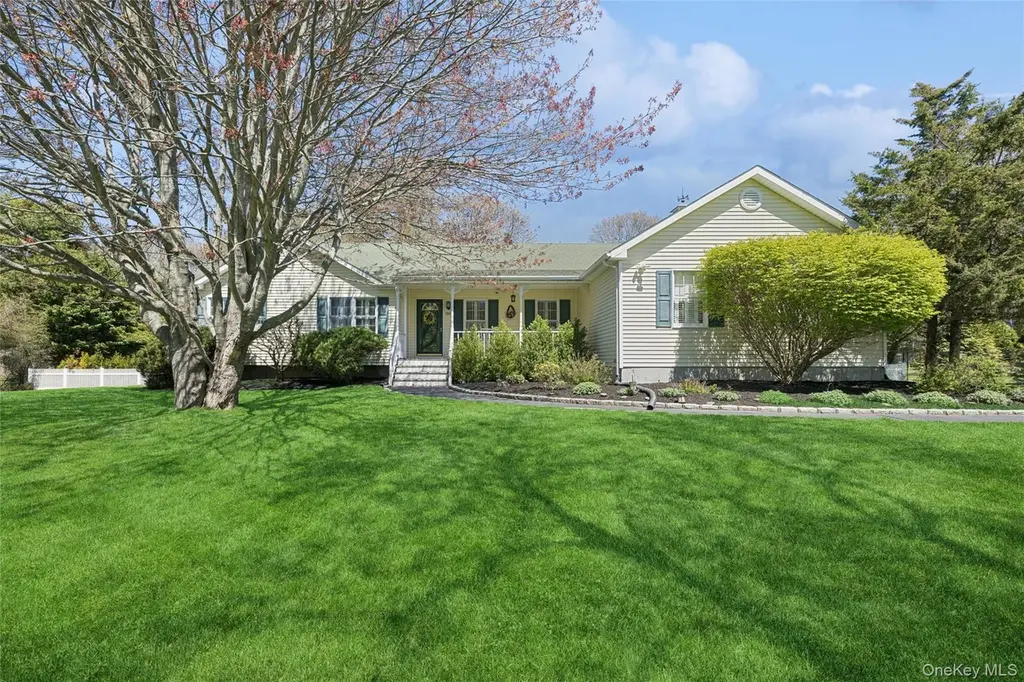
1105 August Ln
Greenport West, NY 11944
$999,999B+
3 bd · 2.0 ba ·
2,120 sqft ·
Built 1998
· SingleFamily
· Pending
· 10 DOM
Cashflow @ list (25.0% down · 7.5%)
Estimated rent
$18,266/mo
Mortgage (P&I)
−$5,244
Tax + insurance
−$1,147
HOA
−$0
Vac / Maint / Mgmt
−$3,836
Net cashflow
$8,039/mo
Annual
$96,474/yr
Cap rate
16.01%
Cash-on-cash
34.69%
DSCR
2.54
1% rule
1.83%
Cash to close
$280,000
Investor read
- This is a 3-bed/2.0-bath single-family listed at $1000k.
- At list price, monthly cash flow is $8k ($96k/yr) — positive.
- The deal already cash-flows at list — no discount required.
- Meets the 1% rule at list price ($18k rent vs $1000k).
- Only 10 days on market — expect competitive offers; lowballing is unlikely to land.
- Local home prices are declining (-3.0%/yr); year-one equity from $7k of loan paydown is wiped out by about $30k of value loss. Plan a longer hold.
- Location reads 58/100 on livability (#1,073 in NY) — a working-class tenant base; expect higher turnover. Strengths: crime A+, employment A+; Watch: amenities F, commute F, cost of living F.
- Greenport Union Free School District (town): math 55% / reading 45% proficiency, ranked #450 of 755 in NY (top 60%) — acceptable for families but not a draw, mixed tenant base, ~2y average lease.
- Zoned schools: Greenport Elementary School (math 47% / reading 62%, grade C, #908 of 2,108 statewide, top 46%, 339 students, 61% FRL); Greenport High School (math 52% / reading 54%, grade C-, #934 of 1,100 statewide, top 86%, 356 students, 63% FRL).
- Watch-outs: flood insurance adds $56/mo.
- Market conditions: 67 active listings in the ZIP; 6 comparable units currently listed for rent nearby; rentals at typical pace (median 25d on market — plan ~3-4 weeks tenant-placement turnaround); 1,366 units permitted in Suffolk County in 2024 (216 in 5+ unit buildings).
- Suffolk County population projected to shrink 5% by 2050 — rents likely to lag national; underwrite the cash flow, not the appreciation.
- 2 sale attempts with the ask held roughly flat each time — persistent listings suggest the price (not the market) is what's stuck; bring a comps-based counter.
- Current owner paid $512k; list at $1000k implies a 95% gain — meaningful room to come down on a strong offer.
- At projected returns (-3.0% appreciation + 3.0% rent growth), your $280k cash investment doubles in ~4 years — after that, you're playing with house money.
- Climate carrying-cost: severe flood risk; severe wind risk, 80% chance of damaging wind over 30y; extreme-heat days projected 7→19/yr by 2055 (HVAC capex compounding) — expect insurance premiums to compound above CPI over the hold.
- Cap rate 16.0% vs local median 8.0% in Greenport West — top-decile yield for the area; either an underpriced asset or a hidden risk that comps aren't pricing in. Stress-test before assuming the spread holds.
Questions for listing agent
- What's the actual annual flood-insurance premium (NFIP or private), and is the property in a SFHA with mandatory coverage?
- Is there a deadline driving the sale (1031 exchange, divorce, estate, relocation)? That informs how much negotiation room exists.
- Schools are D-rated, which usually means shorter tenancies and higher turnover. Who's the typical renter profile here, and what's been the actual vacancy rate?
- What's the average days-on-market for RENTAL listings here right now (not sales)? A rising rental-DOM trend means longer vacancies and softer asking-rent achievability than the comps imply.
- What's the recent tenant-quality profile in this submarket — average credit score on applications, eviction rate, late-payment / NSF rate, and stable-employment percentage? A property-management company in the area should have these aggregated.
- How much new for-sale + rental construction is in the pipeline within 1–3 miles? Heavy new supply typically softens prices + rents 12–24 months out; constrained supply supports both.
CashFlowRE · CFR-W11MDN6V57MFAA
· Data 3 weeks ago
cashflowre.app · 2026-05-29