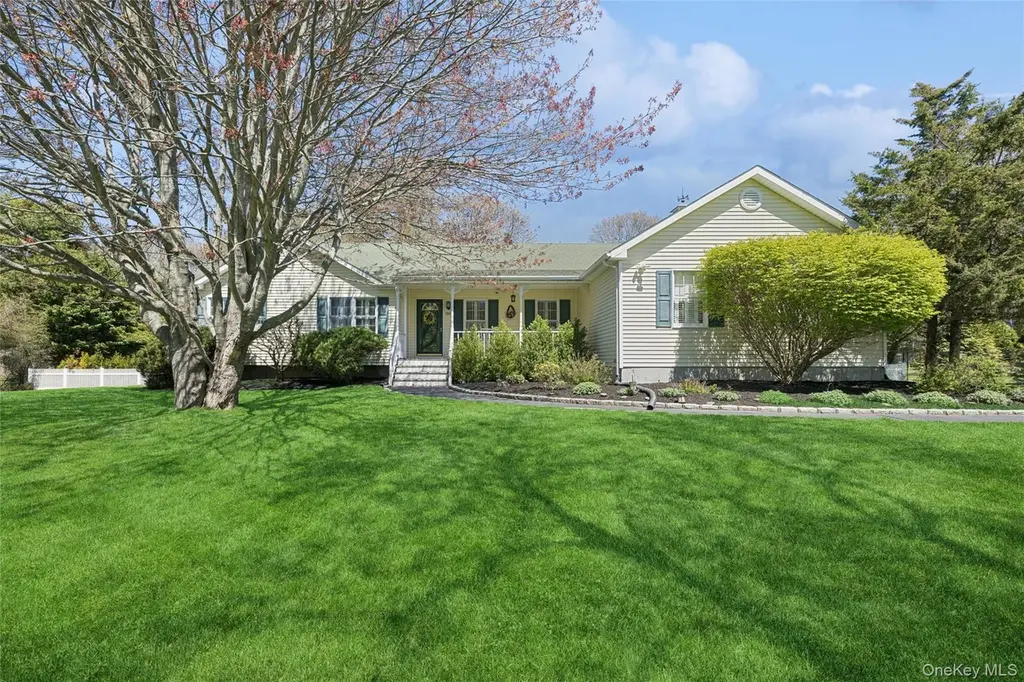
1105 August Ln · Greenport West, NY
Flood risk 8/10 · Major
- FEMA flood zone
- X (unshaded)
- Chance of flooding over 30 yrs
- 0.97%
- Est. flood insurance / yr
- $473 – $860
Fire risk 1/10 · Minimal
- Est. fire insurance / yr
- $691 – $1,283
Heat risk 5/10 · Moderate
- Hot days now (above 90°F)
- 7 days/yr
- Hot days in 30 yrs
- 19 days/yr
Wind risk 8/10 · Major
- Chance of severe wind over 30 yrs
- 80.0%
Air-quality risk 3/10 · Minor
- Unhealthy air days now
- 3 days/yr
- Unhealthy air days in 30 yrs
- 4 days/yr
Risk factors via First Street. Map © Google.
Why this score? — see what drove the B+ grade
The composite is a weighted blend of 9 inputs, each scored 0–100. Each bar is that input's sub-score; the figure is the points it added to the 100-point composite (weight × sub-score).
- Cash flow +30.0/30.0
- ARV discount +15.0/15.0
- 1% rule +10.0/10.0
- DSCR +10.0/10.0
- Schools +4.5/10.0
- Livability +2.9/5.0
- Rent growth +2.5/5.0
- Condition / age +2.5/5.0
- Appreciation +0.0/10.0
$999,999
🖨 Deal sheet 📄 Offer letter ✓ Due diligence
Listing remarks
Welcome to this charming abode. This beautiful residence features three spacious bedrooms and two well-appointed bathrooms, perfect for comfortable living. The house is thoughtfully designed with additional features that add to its allure. Hard wood floors throughout. Buckets of room for a pool on this shy acre. Nestled in the heart of Greenport, the community environment is vibrant and welcoming. The area boasts of various local amenities, including parks, shopping centers, and eateries, ensuring a balanced and enjoyable lifestyle. The property is in excellent condition, offering a blend of comfort and modernity. Its neutral palette and inclusive design make it an ideal choice for anyone l
Key facts
- Hard wood floors
- Room for a pool
- Local amenities
Tags
Property features AI
Exterior
- Parking: Driveway; On-street parking available; Private parking; 2-car garage
- Utilities: Cesspool sewer; Cable connected; Electricity connected; Phone connected; Propane; Sewer connected; Private trash collection; Underground utilities; Water connected
- Home design: Single-family residence
- Construction: Vinyl siding construction
- Exterior features: Vinyl siding; Not waterfront
Interior
- Kitchen: Eat-in kitchen; Granite counters; Quartz/Quartzite counters; Stone counters; Walk-through layout
- Bedrooms: Primary bedroom on the main level; At least one bedroom on the first floor
- Bathrooms: 2 full bathrooms
- Heating & cooling: Baseboard heating; Central air conditioning
- Interior features: First-floor bedroom; First-floor full bath; Cathedral ceilings; Ceiling fans; Chandelier; Eat-in kitchen; Entrance foyer; Formal dining room; Granite counters; High ceilings; High-speed internet; His and hers closets; Primary bathroom; Master suite on main level; Quartz/Quartzite counters; Recessed lighting; Smart thermostat; Sound system with speakers; Stone counters; Storage; Walk-through kitchen; Walk-in closet(s); Washer/dryer hookup; Full basement; Pull-down attic stairs; 7 total rooms
- Laundry & utility: Washer and dryer included; Washer/dryer hookup
Neighborhood map
What this means for you Summary
Snapshot
- This is a 3-bed/2.0-bath single-family listed at $1000k.
Deal economics
- At list price, monthly cash flow is $8k ($96k/yr) — positive.
- The deal already cash-flows at list — no discount required.
- Meets the 1% rule at list price ($18k rent vs $1000k).
- Cap rate 16.0% vs local median 8.0% in Greenport West — top-decile yield for the area; either an underpriced asset or a hidden risk that comps aren't pricing in. Stress-test before assuming the spread holds.
Location & tenants
- Location reads 58/100 on livability (#1,073 in NY) — a working-class tenant base; expect higher turnover. Strengths: crime A+, employment A+; Watch: amenities F, commute F, cost of living F.
- Greenport Union Free School District (town): math 55% / reading 45% proficiency, ranked #450 of 755 in NY (top 60%) — acceptable for families but not a draw, mixed tenant base, ~2y average lease.
- Zoned schools: Greenport Elementary School (math 47% / reading 62%, grade C, #908 of 2,108 statewide, top 46%, 339 students, 61% FRL); Greenport High School (math 52% / reading 54%, grade C-, #934 of 1,100 statewide, top 86%, 356 students, 63% FRL).
- Market conditions: 67 active listings in the ZIP; 6 comparable units currently listed for rent nearby; rentals at typical pace (median 25d on market — plan ~3-4 weeks tenant-placement turnaround); 1,366 units permitted in Suffolk County in 2024 (216 in 5+ unit buildings).
Forward outlook
- Local home prices are declining (-3.0%/yr); year-one equity from $7k of loan paydown is wiped out by about $30k of value loss. Plan a longer hold.
- Suffolk County population projected to shrink 5% by 2050 — rents likely to lag national; underwrite the cash flow, not the appreciation.
- At projected returns (-3.0% appreciation + 3.0% rent growth), your $280k cash investment doubles in ~4 years — after that, you're playing with house money.
Negotiation context
- Only 10 days on market — expect competitive offers; lowballing is unlikely to land.
- 2 sale attempts with the ask held roughly flat each time — persistent listings suggest the price (not the market) is what's stuck; bring a comps-based counter.
- Current owner paid $512k; list at $1000k implies a 95% gain — meaningful room to come down on a strong offer.
Risks & watch-outs
- Watch-outs: flood insurance adds $56/mo.
- Climate carrying-cost: severe flood risk; severe wind risk, 80% chance of damaging wind over 30y; extreme-heat days projected 7→19/yr by 2055 (HVAC capex compounding) — expect insurance premiums to compound above CPI over the hold.
Questions for the listing agent
- What's the actual annual flood-insurance premium (NFIP or private), and is the property in a SFHA with mandatory coverage?
- Is there a deadline driving the sale (1031 exchange, divorce, estate, relocation)? That informs how much negotiation room exists.
- Schools are D-rated, which usually means shorter tenancies and higher turnover. Who's the typical renter profile here, and what's been the actual vacancy rate?
- What's the average days-on-market for RENTAL listings here right now (not sales)? A rising rental-DOM trend means longer vacancies and softer asking-rent achievability than the comps imply.
- What's the recent tenant-quality profile in this submarket — average credit score on applications, eviction rate, late-payment / NSF rate, and stable-employment percentage? A property-management company in the area should have these aggregated.
- How much new for-sale + rental construction is in the pipeline within 1–3 miles? Heavy new supply typically softens prices + rents 12–24 months out; constrained supply supports both.
Investment metrics
- 1% rule
- 1.83% ✓
- Cap rate
- 16.01%
- Cash-on-cash
- 34.69%
- DSCR
- 2.54
- GRM
- 4.6
CMA / ARV
- ARV (median comp)
- $1,406,556
- List price
- $999,999
- Delta
- -28.90%
- Verdict
- UNDERPRICED
- Comps
- 10 within 1.0 mi
Show comp detail 4 sales within ~0.75 mi
| Address | Dist | Beds/Ba | Sqft | Sold | Price | $/sf | Match |
|---|---|---|---|---|---|---|---|
| 1820 Bay Shore Rd | 0.04mi | 3/2.5 | 2,048 (-3%) | 10mo | $999,000 | $488 | 82 |
| 630 Tarpon Dr | 0.55mi | 3/2.5 | 2,100 (-1%) | 2mo | $1,943,000 | $925 | 69 |
| 3080 Bay Shore Rd | 0.24mi | 3/2.0 | 2,200 (+4%) | 22mo | $1,195,000 | $543 | 64 |
| 4295 Bay Shore Rd | 0.44mi | 3/2.0 | 2,016 (-5%) | 21mo | $1,850,000 | $918 | 53 |
Match score weights: distance 35% · size 25% · config 20% · recency 20%. Top-matched comps best support the ARV.
Projected returns pro-forma
-3.0% appreciation · 3.0% rent growth · sell at horizon
- IRR
- 29.9%
- Equity multiple
- 2.25×
- Total profit
- $349,951
- Equity at exit
- $149,103
- IRR
- 37.2%
- Equity multiple
- 4.44×
- Total profit
- $963,883
- Equity at exit
- $86,462
Cash invested: $280,000 (down + closing). Projections, not guarantees.
Landlord ↔ Tenant lean methodology
- Overall (STATE)
- 15 Strongly Tenant-Friendly
- State New York
- 15 Strongly Tenant-Friendly · D+10
- County
- — inherits STATE
- City
- — inherits STATE
ZIP-level market 11944
- Home prices YoY
- -23.7%
- Active inventory
- 67
- Price-to-rent
- 4.6×
Monthly cashflow live
- Estimated rent
- $18,266 medium interval (Pro) →
- Mortgage (P&I)
- −$5,244
- Tax from tax record
- −$674 /mo · $8,092/yr
- Insurance
- −$417
- Flood insurance flood zone
- −$56 /mo · $666/yr
- HOA
- −$0
- Vacancy / Maint / Mgmt
- −$3,836
- Net cashflow
- $8,039
Break-even live
UW: 25.0% down · 7.5% · 30yr · 1.5% tax · 5.0% vac · 8.0% maint · 8.0% mgmt
Financing live
Cash to close
- Down payment
- $250,000
- Closing costs
- $30,000
- Reserves months
- —
- Total cash needed
- —
Loan-product check · same deal, 3 products live
Conventional
25% down · 7.5% · 30yr
- Down + closing
- —
- Monthly P&I
- —
- Monthly cashflow
- —
- DSCR
- —
- Eligible?
- —
Personal DTI + credit; lowest rate.
DSCR
20% down · 8.5% · 30yr
- Down + closing
- —
- Monthly P&I
- —
- Monthly cashflow
- —
- DSCR
- —
- Eligible?
- —
No personal income docs; deal must DSCR.
Hard money
10% down · 12.0% · 12mo
- Down + closing
- —
- Monthly P&I
- —
- Monthly cashflow
- —
- DSCR
- —
- Eligible?
- —
Short-term bridge; refi at stabilization.
Rent comps 6 comps
| Address | Beds | Baths | Sqft | Rent | $/sqft | DOM | Units | Dist |
|---|---|---|---|---|---|---|---|---|
| 3650 Bay Shore Rd Greenport, NY | 3.0 | 3.0 | 2400 | $10,000 | $4.17 | 24d | 1 | 0.30mi |
| 465 Tarpon Dr Southold, NY | 3.0 | 2.5 | 1572 | $20,000 | $12.72 | 24d | 1 | 0.55mi |
| 131 6th St Unit G Greenport, NY | 3.0 | 2.5 | 2238 | $5,000 | $2.23 | 24d | 1 | 1.02mi |
| 134 6th St Greenport, NY | 3.0 | 2.0 | 1560 | $18,500 | $11.86 | 19d | 1 | 1.08mi |
| 237 6th St Greenport, NY | 2.0 | 2.5 | 1452 | $14,000 | $9.64 | 11d | 1 | 1.16mi |
| 64230 North Rd Greenport, NY | 4.0 | 3.0 | 2800 | $6,500 | $2.32 | 43d | 1 | 1.45mi |
Listing history 8 events
-
2026-05-12status Pending 967-char remark
-
2026-04-20$999,999 Active 967-char remark
-
2025-02-18historical
-
2025-02-13$1,150,000 Active
-
2025-02-10price $1,150,000
-
2025-01-31historical
-
2009-04-10soldstatus $512,500
-
1998-12-14soldstatus $40,000
ⓘ Source: listings_history table (triggers on properties + properties_extension) + one-shot
backfill from property_details.listing_events for pre-trigger history.
Tax reassessment forecast NY · Partial reset (capped growth)
- Current annual tax
- $8,092 · $674/mo
- Projected year-2 tax
- $12,496 · $1,041/mo
- Expected delta
- +$4,404/yr (+$367/mo · 54.4%)
ⓘ Screening estimate from a state-policy table — verify with the county assessor before closing.
Climate risk First Street
- Flood 8/10 Severe FEMA zone X (unshaded) · 97% chance over 30 yrs
- Wildfire 1/10 Low
- Heat 5/10 Major 7 d/yr ≥90°F today · 19 d/yr by 30 yrs out
- Wind 8/10 Severe 80% chance of damaging wind over 30 yrs
- Air quality 3/10 Moderate 3 unhealthy d/yr today · 4 by 30 yrs out
Nearby sold comps map
Loading sold comps map…
Walkable amenities ~0.75 mi
Loading nearby amenities…
Taxation est. · year 1
- Rental income
- $219,192
- − Mortgage interest
- −$56,015
- − Property taxes
- −$8,092
- − Insurance
- −$5,666
- − Repairs & maintenance
- −$17,535
- − Management
- −$17,535
- − Depreciation
- −$29,091
- Taxable income
- $85,256
- Est. tax owed @ 24.0%
- −$20,461
- After-tax cash flow
- $76,012/yr
For passive investors: Depreciation is non-cash, so a rental often shows a tax loss while cash-flowing — sheltering income. Rental losses are passive: they offset passive income freely, and up to $25,000/yr can offset ordinary (W-2) income if you actively participate and your MAGI is under $100k (phasing out to $0 by $150k); unused losses carry forward. On sale, claimed depreciation is recaptured at up to 25%, and gains may owe capital-gains tax (a 1031 exchange can defer both). Figures are a year-1 estimate at your 24.0% rate — not tax advice; consult a CPA.
Schools (NCES district)
- District
- Greenport Union Free School District
- NCES district ID
- 3612840
- Math proficiency
- 55% ▲ 5.00%
- Reading proficiency
- 45% ▼ -5.00%
- Median HH income
- $54,490
- Composite
- 45.25/100
- National rank
- #5759
- State rank
- #450 of 755 in NY
Livability — Greenport West
- Score
- 58/100
- State rank
- #1073
- US rank
- #21520
Category grades
Schools grade is shown separately in the Schools card above.
Census & demographics
- Census place
- Greenport West, NY
- Population (ZIP)
- 4,744
Population outlook (Suffolk County) Hauer SSP2
- Today (2025)
- 1,505,262 people
- By 2030
- 1,498,318 · -0.5%
- By 2040
- 1,471,101 · -2.3%
- By 2050
- 1,424,848 · -5.3%
- By 2075
- 1,337,157 · -11.2%
- By 2100
- 1,217,720 · -19.1%
Race, ethnicity, and origin ACS 2023
- Neighborhood character
- Predominantly White (69%)
- Race & ethnicity
- White 69% Hispanic / Latino 23% Two or more races 6% Black 4% Asian 2%
- Hispanic origin (detail)
- Mexican 5% Puerto Rican 2%
- Common ancestry
- Romanian 6% Lithuanian 2% Subsaharan African 2%
- Foreign-born
- 19% · Canada, China
- Languages at home
- 69% English-only · Spanish 22% German/W. Germanic 3% Russian/Polish/Slavic 2%
Political lean MEDSL · Suffolk
- 2024 margin
- Lean R (+10.0) · D 45.0% · R 55.0%
- 2008→2024 swing
- -16.0pp toward R · 2008: 6.0pp · 2024: -10.0pp
- All cycles
- 2024: R+10.0 2020: R+0.0 2016: R+8.2 2012: D+2.9 2008: D+6.0
Not yet ingested
- Civics
- —
Market trends
- HPI YoY
- ▼ -143.97%
- Current HPI
- 462.3431
- Rent YoY
- —
- Metro
- —
- State GDP YoY
- ▲ 2.60%
- F500 in state
- 92
Industry mix (Fortune 500 HQ in NY)
| Industry | F500 HQs | Revenue |
|---|---|---|
| Financial Services | 10 | $950B |
|
||
| Consumer Goods | 9 | $162B |
|
||
| Insurance | 4 | $225B |
|
||
| Telecommunications | 2 | $144B |
|
||
| Pharmaceuticals | 2 | $112B |
|
||
| Media / Entertainment | 2 | $69B |
|
||
Price history
+2400.0% since first listed8 events — show timeline
- 2026-05-12 Pending — OneKey® MLS as Distributed by MLS Grid
- 2026-04-20 Listed $999,999 OneKey® MLS as Distributed by MLS Grid
- 2025-02-18 Listing Removed — OneKey® MLS as Distributed by MLS Grid
- 2025-02-13 Listed $1,150,000 OneKey® MLS as Distributed by MLS Grid
- 2025-02-10 Price Changed $1,150,000 OneKey® MLS as Distributed by MLS Grid
- 2025-01-31 Coming Soon — OneKey® MLS as Distributed by MLS Grid
- 2009-04-10 Sold (Public Records) $512,500 Public Records
- 1998-12-14 Sold (Public Records) $40,000 Public Records
Property tax history
+1.8%/yrLatest (2025): $8,092 · +0.0% YoY. Source: county tax records.
Cash-flow waterfall
monthlySold comps — $/sqft
last 12 mo · ≤1 miLoading sold comps…