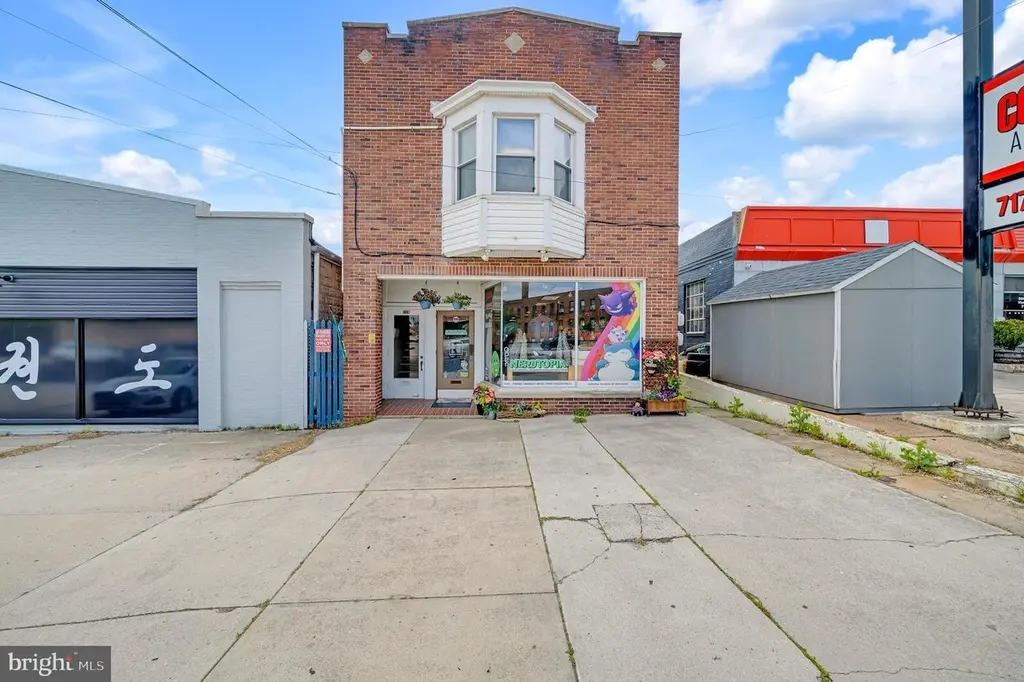
318 Carlisle St
Hanover, PA 17331
$425,000B-
4 bd · None ba ·
6,891 sqft ·
Built 1932
· MultiFamily
· Active Under Contract
· 29 DOM
Cashflow @ list (25.0% down · 7.5%)
Estimated rent
$5,420/mo
Mortgage (P&I)
−$2,229
Tax + insurance
−$708
HOA
−$0
Vac / Maint / Mgmt
−$1,138
Net cashflow
$1,345/mo
Annual
$16,137/yr
Cap rate
10.09%
Cash-on-cash
13.56%
DSCR
1.60
1% rule
1.28%
Cash to close
$119,000
Investor read
- This is a 4-bed/?-bath multifamily listed at $425k. Condition is rated good.
- At list price, monthly cash flow is $1k ($16k/yr) — positive.
- The deal already cash-flows at list — no discount required.
- Meets the 1% rule at list price ($5k rent vs $425k).
- It's been on market 29 days — a 2% lower offer ($419k) is reasonable based on typical stale-listing flexibility.
- Recommended offer: $419k (1.5% below list) — sets the bar for market timing.
- Local home prices are declining (-3.0%/yr); year-one equity from $3k of loan paydown is wiped out by about $13k of value loss. Plan a longer hold.
- Location reads 76/100 on livability (#373 in PA, #3,295 nationally) — a middle-class / working-renter tenant base. Strengths: cost of living A+, housing A+, health & safety A+; Watch: amenities C-, employment D, commute F.
- Hanover Public SD (urban): math 34% / reading 54% proficiency, ranked #294 of 539 in PA (top 54%) — families likely to look elsewhere, expect single-tenant / working-renter base with shorter leases.
- Zoned schools: Clearview El Sch (math 52% / reading 72%, grade B, #313 of 1,518 statewide, top 24%, 241 students, 66% FRL); Hanover Ms (math 22% / reading 48%, grade F, #322 of 512 statewide, top 64%, 615 students, 69% FRL); Hanover Shs (math 67%, 585 students, 64% FRL) — zoned schools average 67% FRL vs 49% district-wide (17 pts higher); higher-poverty schools than district average — tighter screening recommended.
- Watch-outs: built in 1932 — expect roof / HVAC / electrical / plumbing capex.
- Market conditions: Rents rising fast (+4.7%/yr); 391 active listings in the ZIP; solid renter incomes; 1,328 units permitted in York County in 2024 (338 in 5+ unit buildings).
- At projected returns (-3.0% appreciation + 4.7% rent growth), your $119k cash investment doubles in ~8 years — after that, you're playing with house money.
- Cap rate 10.1% vs local median 3.7% in Hanover — top-decile yield for the area; either an underpriced asset or a hidden risk that comps aren't pricing in. Stress-test before assuming the spread holds.
- At $5,420/mo this rent would consume 82% of the median local household income ($79k/yr) (locally 1076% of renters already pay >50% of income on rent) — very limited rent-growth headroom before tenants either downsize or default.
Questions for listing agent
- Built in 1932 — when were the roof, HVAC, electrical panel, plumbing, and water heater last replaced?
- Is there a deadline driving the sale (1031 exchange, divorce, estate, relocation)? That informs how much negotiation room exists.
- What's the average days-on-market for RENTAL listings here right now (not sales)? A rising rental-DOM trend means longer vacancies and softer asking-rent achievability than the comps imply.
- What's the recent tenant-quality profile in this submarket — average credit score on applications, eviction rate, late-payment / NSF rate, and stable-employment percentage? A property-management company in the area should have these aggregated.
- How much new apartment / multifamily construction is in the pipeline within 1–3 miles? Heavy new supply (>2% of stock underway) typically softens rents 12–24 months out; light construction supports rent growth.
CashFlowRE · CFR-W169A946W4YJNX
· Data 13 h ago
cashflowre.app · 2026-05-29