 Multi-family
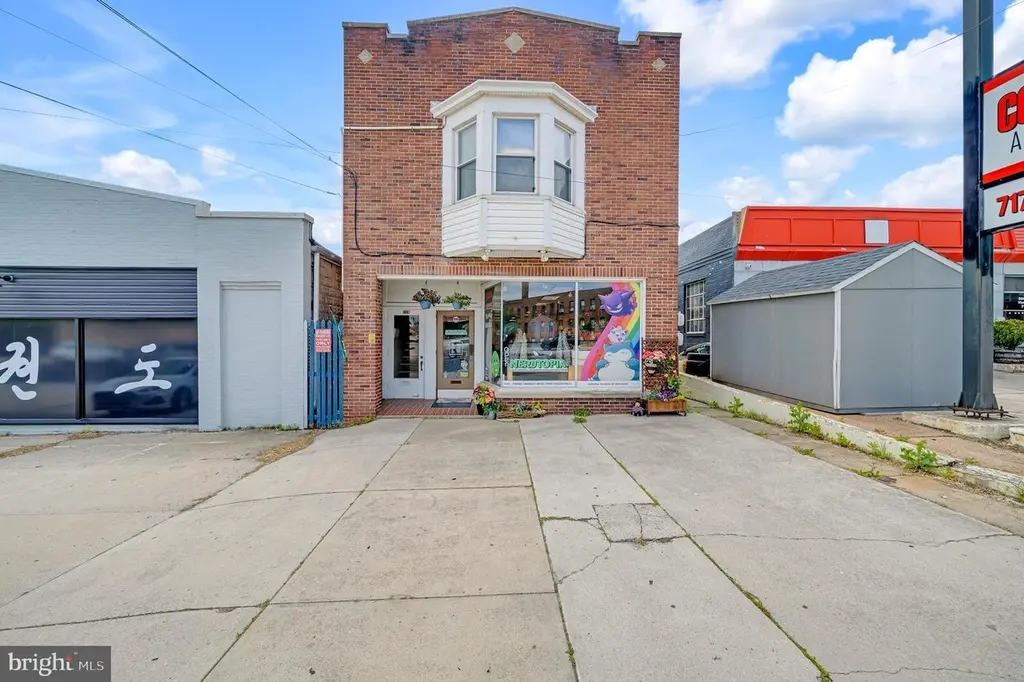
318 Carlisle St · Hanover, PA
Flood risk No data
- FEMA flood zone
- —
- Chance of flooding over 30 yrs
- —
- Est. flood insurance / yr
- —
Fire risk No data
- Est. fire insurance / yr
- —
Heat risk No data
- Hot days now (above threshold)
- —
- Hot days in 30 yrs
- —
Wind risk No data
- Chance of severe wind over 30 yrs
- —
Air-quality risk No data
- Unhealthy air days now
- —
- Unhealthy air days in 30 yrs
- —
Risk factors via First Street. Map © Google.
Why this score? — see what drove the B- grade
The composite is a weighted blend of 9 inputs, each scored 0–100. Each bar is that input's sub-score; the figure is the points it added to the 100-point composite (weight × sub-score).
- Cash flow +28.2/30.0
- DSCR +10.0/10.0
- 1% rule +7.8/10.0
- ARV discount +7.5/15.0
- Livability +3.8/5.0
- Condition / age +3.8/5.0
- Rent growth +3.7/5.0
- Schools +3.7/10.0
- Appreciation +0.0/10.0
$425,000
🖨 Deal sheet (PDF) 📄 Offer letter ✓ Due diligence
Multi-family units
County records classify this as Multi-Family (2-4 Unit). Listing-text estimate: 1 unit. estimate disagrees with records
Listing remarks
Prime Downtown Hanover Investment Opportunity! Welcome to the heart of Hanover—where charm, history, and opportunity meet. This solid, all-brick mixed-use building is a standout investment in a rapidly growing and revitalized downtown district. The lower level features one retail storefront that is currently leased with established tenants who would love to stay, providing immediate and reliable income from day one. Above, you’ll find two spacious residential apartments, each offering two bedrooms, beautiful hardwood flooring, and timeless vintage character that tenants truly appreciate. One unit is currently rented, while the other presents a fantastic opportunity for additiona
Key facts
- Hardwood flooring
- Private parking lot
- Retail storefront
Tags
Property features AI
Finance
- Other: Finished above-grade area is approximately 6,891 (estimated); Finished/unfinished below-grade area information sourced from assessor
- Financial info: Fee simple ownership; Building contains a total of 3 units
Exterior
- Parking: Paved parking in a parking lot
- Utilities: Public water; Public sewer; Electric available; Natural gas available; Electric hot water
- Home design: Detached structure; Above-grade and below-grade structures noted
- Construction: Built (year sourced from assessor); Block and brick construction; Brick/mortar foundation; Asphalt roof
- Exterior features: Downtown location; Ground rent paid annually; No tidal water
Interior
- Bedrooms: Two 2-bedroom units (part of a 3-unit building)
- Flooring: Carpet; Hardwood; Laminate plank
- Heating & cooling: Hot water baseboard heating; Natural gas heating
- Interior features: Estimated living area; Excellent condition
Neighborhood map
What this means for you Summary
Snapshot
- This is a 4-bed/?-bath multifamily listed at $425k. Condition is rated good.
Deal economics
- At list price, monthly cash flow is $1k ($16k/yr) — positive.
- The deal already cash-flows at list — no discount required.
- Meets the 1% rule at list price ($5k rent vs $425k).
- Recommended offer: $419k (1.5% below list) — sets the bar for market timing.
- Cap rate 10.1% vs local median 3.7% in Hanover — top-decile yield for the area; either an underpriced asset or a hidden risk that comps aren't pricing in. Stress-test before assuming the spread holds.
Location & tenants
- Location reads 76/100 on livability (#373 in PA, #3,295 nationally) — a middle-class / working-renter tenant base. Strengths: cost of living A+, housing A+, health & safety A+; Watch: amenities C-, employment D, commute F.
- Hanover Public SD (urban): math 34% / reading 54% proficiency, ranked #294 of 539 in PA (top 54%) — families likely to look elsewhere, expect single-tenant / working-renter base with shorter leases.
- Zoned schools: Clearview El Sch (math 52% / reading 72%, grade B, #313 of 1,518 statewide, top 24%, 241 students, 66% FRL); Hanover Ms (math 22% / reading 48%, grade F, #322 of 512 statewide, top 64%, 615 students, 69% FRL); Hanover Shs (math 67%, 585 students, 64% FRL) — zoned schools average 67% FRL vs 49% district-wide (17 pts higher); higher-poverty schools than district average — tighter screening recommended.
- Market conditions: Rents rising fast (+4.7%/yr); 391 active listings in the ZIP; solid renter incomes; 1,328 units permitted in York County in 2024 (338 in 5+ unit buildings).
- At $5,420/mo this rent would consume 82% of the median local household income ($79k/yr) (locally 1076% of renters already pay >50% of income on rent) — very limited rent-growth headroom before tenants either downsize or default.
Forward outlook
- Local home prices are declining (-3.0%/yr); year-one equity from $3k of loan paydown is wiped out by about $13k of value loss. Plan a longer hold.
- At projected returns (-3.0% appreciation + 4.7% rent growth), your $119k cash investment doubles in ~8 years — after that, you're playing with house money.
Negotiation context
- It's been on market 29 days — a 2% lower offer ($419k) is reasonable based on typical stale-listing flexibility.
Risks & watch-outs
- Watch-outs: built in 1932 — expect roof / HVAC / electrical / plumbing capex.
Questions for the listing agent
- Built in 1932 — when were the roof, HVAC, electrical panel, plumbing, and water heater last replaced?
- Is there a deadline driving the sale (1031 exchange, divorce, estate, relocation)? That informs how much negotiation room exists.
- What's the average days-on-market for RENTAL listings here right now (not sales)? A rising rental-DOM trend means longer vacancies and softer asking-rent achievability than the comps imply.
- What's the recent tenant-quality profile in this submarket — average credit score on applications, eviction rate, late-payment / NSF rate, and stable-employment percentage? A property-management company in the area should have these aggregated.
- How much new apartment / multifamily construction is in the pipeline within 1–3 miles? Heavy new supply (>2% of stock underway) typically softens rents 12–24 months out; light construction supports rent growth.
Investment metrics
- 1% rule
- 1.28% ✓
- Cap rate
- 10.09%
- Cash-on-cash
- 13.56%
- DSCR
- 1.60
- GRM
- 6.5
CMA / ARV
No comps found within radius.
Projected returns pro-forma
-3.0% appreciation · 4.67% rent growth · sell at horizon
- IRR
- 5.5%
- Equity multiple
- 1.22×
- Total profit
- $26,118
- Equity at exit
- $63,369
- IRR
- 16.4%
- Equity multiple
- 2.45×
- Total profit
- $172,668
- Equity at exit
- $36,746
Cash invested: $119,000 (down + closing). Projections, not guarantees.
Landlord ↔ Tenant lean methodology
- Overall (STATE)
- 62 Landlord-Friendly
- State Pennsylvania
- 62 Landlord-Friendly · EVEN
- County
- — inherits STATE
- City
- — inherits STATE
ZIP-level market 17331
- Home prices YoY
- -33.8%
- Rents YoY
- 4.7%
- Active inventory
- 391
- Price-to-rent
- 19.6×
Monthly cashflow live
- Estimated rent
- $5,420 high interval (Pro) →
- Mortgage (P&I)
- −$2,229
- Tax est. 1.5%
- −$531 /mo · $6,375/yr
- Insurance
- −$177
- HOA
- −$0
- Vacancy / Maint / Mgmt
- −$1,138
- Net cashflow
- $1,345
Break-even live
Sensitivity live
| Price | -10% $1,638 | -5% $1,492 | +0% $1,345 | +5% $1,198 | +10% $1,051 |
|---|---|---|---|---|---|
| Rent | -10% $917 | -5% $1,131 | +0% $1,345 | +5% $1,559 | +10% $1,773 |
| Rate | -1.0pp $1,559 | -0.5pp $1,453 | base $1,345 | +0.5pp $1,235 | +1.0pp $1,123 |
3-unit breakdown (identical units grouped — click to expand)
| Units | Beds | Baths | Est. rent |
|---|---|---|---|
| 3× units | 2 | 1 | $5,421 |
| #1 | 2 | 1 | $1,807 |
| #2 | 2 | 1 | $1,807 |
| #3 | 2 | 1 | $1,807 |
| Total (3 units) | $5,420 | ||
UW: 25.0% down · 7.5% · 30yr · 1.5% tax · 5.0% vac · 8.0% maint · 8.0% mgmt
Financing live
Cash to close
- Down payment
- $106,250
- Closing costs
- $12,750
- Reserves months
- —
- Total cash needed
- —
Loan-product check · same deal, 3 products live
Conventional
25% down · 7.5% · 30yr
- Down + closing
- —
- Monthly P&I
- —
- Monthly cashflow
- —
- DSCR
- —
- Eligible?
- —
Personal DTI + credit; lowest rate.
DSCR
20% down · 8.5% · 30yr
- Down + closing
- —
- Monthly P&I
- —
- Monthly cashflow
- —
- DSCR
- —
- Eligible?
- —
No personal income docs; deal must DSCR.
Hard money
10% down · 12.0% · 12mo
- Down + closing
- —
- Monthly P&I
- —
- Monthly cashflow
- —
- DSCR
- —
- Eligible?
- —
Short-term bridge; refi at stabilization.
Listing history 17 events
-
2026-06-22statusdays on market $425,000 Active Under Contract 29 DOM
-
2026-06-18days on market $425,000 Active 28 DOM
-
2026-06-17days on market $425,000 Active 27 DOM
-
2026-06-16days on market $425,000 Active 26 DOM
-
2026-06-15days on market $425,000 Active 25 DOM
-
2026-06-14days on market $425,000 Active 23 DOM
-
2026-06-13days on market $425,000 Active 22 DOM
-
2026-06-10days on market $425,000 Active 20 DOM
-
2026-06-09days on market $425,000 Active 19 DOM
-
2026-06-08days on market $425,000 Active 18 DOM
-
2026-06-07days on market $425,000 Active 17 DOM
-
2026-06-03days on market $425,000 Active 13 DOM
-
2026-06-02days on market $425,000 Active 12 DOM
-
2026-06-01days on market $425,000 Active 11 DOM
-
2026-05-31days on market $425,000 Active 10 DOM
-
2026-05-30days on market $425,000 Active 9 DOM
-
2026-05-21$425,000 Active
ⓘ Source: listings_history table (triggers on properties + properties_extension) + one-shot
backfill from property_details.listing_events for pre-trigger history.
Nearby sold comps map
Loading sold comps map…
Walkable amenities ~0.75 mi
Loading nearby amenities…
Taxation est. · year 1
- Rental income
- $65,040
- − Mortgage interest
- −$23,807
- − Property taxes
- −$6,375
- − Insurance
- −$2,125
- − Repairs & maintenance
- −$5,203
- − Management
- −$5,203
- − Depreciation
- −$12,364
- Taxable income
- $9,963
- Est. tax owed @ 24.0%
- −$2,391
- After-tax cash flow
- $13,745/yr
For passive investors: Depreciation is non-cash, so a rental often shows a tax loss while cash-flowing — sheltering income. Rental losses are passive: they offset passive income freely, and up to $25,000/yr can offset ordinary (W-2) income if you actively participate and your MAGI is under $100k (phasing out to $0 by $150k); unused losses carry forward. On sale, claimed depreciation is recaptured at up to 25%, and gains may owe capital-gains tax (a 1031 exchange can defer both). Figures are a year-1 estimate at your 24.0% rate — not tax advice; consult a CPA.
Condition & rehab AI · 12 photos
This mixed-use property offers a good investment opportunity with a solid structure and good condition. The current tenants are leasehold, providing immediate income. Upgrades to the interior and exterior can further enhance its value.
Value-add opportunities
- Both Painting and updating the interior decor — Fresh paint and updated decor can enhance the appeal for both buyers and renters
- Both Upgrading the kitchen appliances — Modern appliances can attract more buyers and renters
- Both Upgrading the HVAC system — A new HVAC system can improve comfort and energy efficiency
- Both Landscaping the front yard — A well-maintained front yard can improve curb appeal and attract more buyers
Renovation cost estimate screening
Value-add ROI direction
- Both Painting and updating the interior decor — Fresh paint and updated decor can enhance the appeal for both buyers and renters ↑
- Both Upgrading the kitchen appliances — Modern appliances can attract more buyers and renters ↑
- Both Upgrading the HVAC system — A new HVAC system can improve comfort and energy efficiency ↑
- Both Landscaping the front yard — A well-maintained front yard can improve curb appeal and attract more buyers ↑
ⓘ Cost ranges are severity-bucket heuristics (US national rule-of-thumb). Get contractor quotes + a written scope before underwriting a rehab budget.
Schools (NCES district)
- District
- Hanover Public SD
- NCES district ID
- 4211450
- Math proficiency
- 34% ▼ -11.00%
- Reading proficiency
- 54% ▼ -8.00%
- Median HH income
- $45,022
- Composite
- 37.26/100
- National rank
- #4457
- State rank
- #294 of 539 in PA
Livability — Hanover
- Score
- 76/100
- State rank
- #373
- US rank
- #3295
Category grades
Schools grade is shown separately in the Schools card above.
Census & demographics
- Census place
- Hanover, PA
- County
- York County · 278,806 people
- City population
- 56,443
- Metro
- York-Hanover, PA
- Population (ZIP)
- 56,443
- Household income
- $79,488
- Rent vs Own
- Severe rent burden
- 1076.0
Population outlook (York County) Hauer SSP2
- Today (2025)
- 454,205 people
- By 2030
- 457,407 · +0.7%
- By 2040
- 457,529 · +0.7%
- By 2050
- 448,261 · -1.3%
- By 2075
- 427,388 · -5.9%
- By 2100
- 384,218 · -15.4%
Race, ethnicity, and origin ACS 2023
- Neighborhood character
- Predominantly White (86%)
- Race & ethnicity
- White 86% Hispanic / Latino 7% Two or more races 7% Black 3% Asian 1%
- Hispanic origin (detail)
- Mexican 3% Puerto Rican 2%
- Common ancestry
- Romanian 3% Lithuanian 2% Slovak 2%
- Foreign-born
- 4% · Canada
- Languages at home
- 95% English-only · Spanish 3%
Political lean MEDSL · York
- 2024 margin
- Strong R (+25.3) · D 36.9% · R 62.1%
- 2008→2024 swing
- -11.7pp toward R · 2008: -13.6pp · 2024: -25.3pp
- All cycles
- 2024: R+25.3 2020: R+24.6 2016: R+29.3 2012: R+21.2 2008: R+13.6
Not yet ingested
- Civics
- —
Market trends
- HPI YoY
- ▼ -128.48%
- Current HPI
- 251.8974
- Rent YoY
- ▲ 4.67%
- Metro
- York-Hanover, PA
- State GDP YoY
- ▲ 1.68%
- F500 in state
- 34
Industry mix (Fortune 500 HQ in PA)
| Industry | F500 HQs | Revenue |
|---|---|---|
| Healthcare | 2 | $309B |
|
||
| Insurance | 2 | $27B |
|
||
| Telecommunications / Media | 1 | $124B |
|
||
| Industrial Distribution | 1 | $22B |
|
||
| Financial Services | 1 | $20B |
|
||
| Chemicals / Materials | 1 | $18B |
|
||
Price history
1 event — show timeline
- 2026-05-21 Listed $425,000 BRIGHT MLS
Cash-flow waterfall
monthlySold comps — $/sqft
last 12 mo · ≤1 miLoading sold comps…