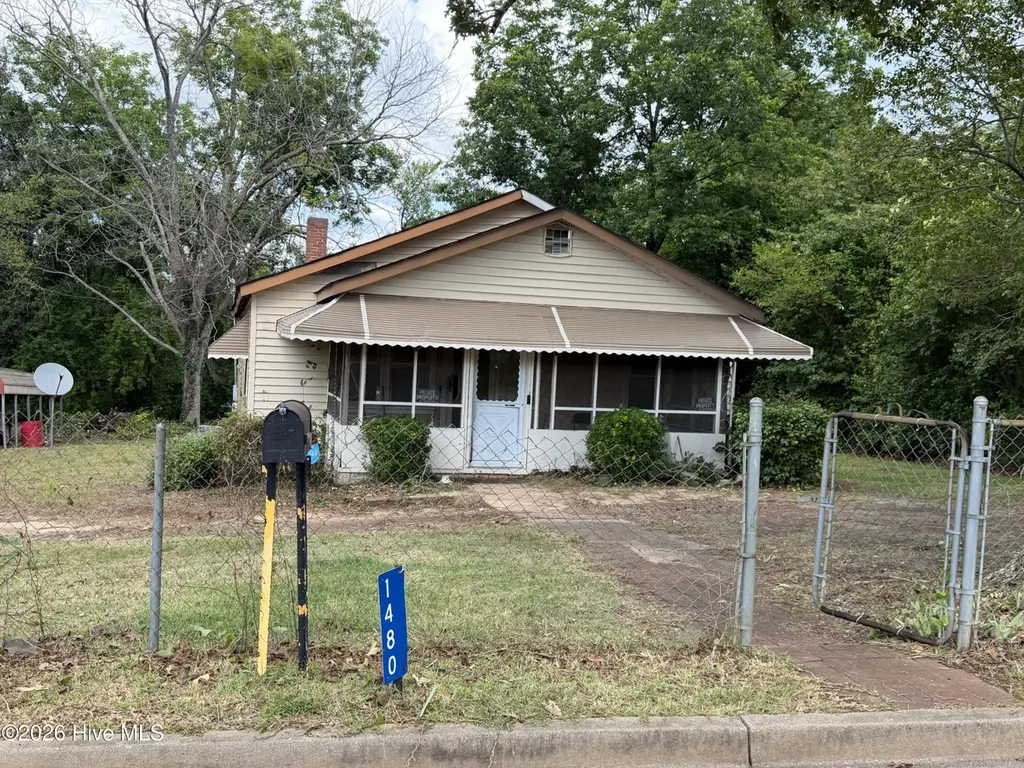
1480 Price St
Louisville, GA 30434
$35,000B
3 bd · 1.0 ba ·
1,306 sqft ·
Built 1959
· SingleFamily
· Pending
· 5 DOM
Cashflow @ list (25.0% down · 7.5%)
Estimated rent
$1,067/mo
Mortgage (P&I)
−$184
Tax + insurance
−$60
HOA
−$0
Vac / Maint / Mgmt
−$224
Net cashflow
$599/mo
Annual
$7,186/yr
Cap rate
26.82%
Cash-on-cash
73.33%
DSCR
4.26
1% rule
3.05%
Cash to close
$9,800
Investor read
- This is a 3-bed/1.0-bath single-family listed at $35k.
- At list price, monthly cash flow is $599 ($7k/yr) — positive.
- The deal already cash-flows at list — no discount required.
- Meets the 1% rule at list price ($1k rent vs $35k).
- Only 5 days on market — expect competitive offers; lowballing is unlikely to land.
- Local home prices are declining (-2.0%/yr); year-one equity from $242 of loan paydown is wiped out by about $706 of value loss. Plan a longer hold.
- Location reads 57/100 on livability (#471 in GA) — a working-class tenant base; expect higher turnover. Strengths: cost of living A+, housing A+, crime A-; Watch: amenities F, commute F, employment F.
- Jefferson County (rural): math 10% / reading 15% proficiency, ranked #166 of 174 in GA (top 95%) — low school quality limits family demand, transient renter base, plan for 1-2y turnover; 78% free/reduced lunch — lower-income household profile, screen leases tightly.
- Zoned schools: Louisville Academy (math 17% / reading 12%, grade F, #996 of 1,228 statewide, top 83%, 350 students, 100% FRL); Jefferson County Middle School (math 7% / reading 17%, grade F, #417 of 470 statewide, top 90%, 458 students, 100% FRL); Jefferson County High School (math 2% / reading 8%, grade F, #394 of 424 statewide, top 97%, 631 students, 100% FRL) — zoned schools average 100% FRL vs 78% district-wide (22 pts higher); higher-poverty schools than district average — tighter screening recommended.
- Watch-outs: built in 1959 — expect roof / HVAC / electrical / plumbing capex.
- Market conditions: 28 active listings in the ZIP; 10 units permitted in Jefferson County in 2024 (0 in 5+ unit buildings).
- Jefferson County population projected at -31% by 2050 — secular population decline; favor cash flow + early exit over multi-decade hold.
- At projected returns (-2.0% appreciation + 3.0% rent growth), your $10k cash investment doubles in ~2 years — after that, you're playing with house money.
- Climate carrying-cost: major wind risk, 75% chance of damaging wind over 30y; extreme-heat days projected 7→17/yr by 2055 (HVAC capex compounding) — expect insurance premiums to compound above CPI over the hold.
Questions for listing agent
- Built in 1959 — when were the roof, HVAC, electrical panel, plumbing, and water heater last replaced?
- Is there a deadline driving the sale (1031 exchange, divorce, estate, relocation)? That informs how much negotiation room exists.
- Schools are F-rated, which usually means shorter tenancies and higher turnover. Who's the typical renter profile here, and what's been the actual vacancy rate?
- What's the average days-on-market for RENTAL listings here right now (not sales)? A rising rental-DOM trend means longer vacancies and softer asking-rent achievability than the comps imply.
- What's the recent tenant-quality profile in this submarket — average credit score on applications, eviction rate, late-payment / NSF rate, and stable-employment percentage? A property-management company in the area should have these aggregated.
- How much new for-sale + rental construction is in the pipeline within 1–3 miles? Heavy new supply typically softens prices + rents 12–24 months out; constrained supply supports both.
CashFlowRE · CFR-W18D73C4PXK2KV
· Data 2 weeks ago
cashflowre.app · 2026-05-29