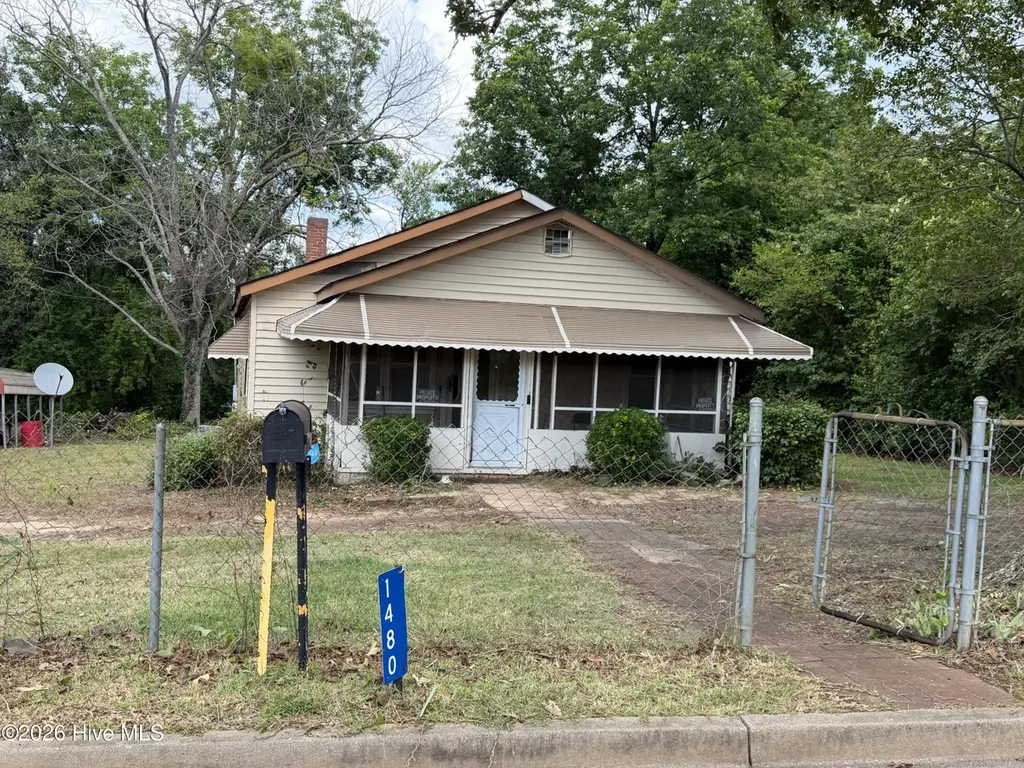
1480 Price St · Louisville, GA
Flood risk 1/10 · Minimal
- FEMA flood zone
- X (unshaded)
- Chance of flooding over 30 yrs
- 0.0%
- Est. flood insurance / yr
- $507 – $1,088
Fire risk 4/10 · Minor
- Est. fire insurance / yr
- $963 – $1,789
Heat risk 7/10 · Major
- Hot days now (above 109°F)
- 7 days/yr
- Hot days in 30 yrs
- 17 days/yr
Wind risk 7/10 · Major
- Chance of severe wind over 30 yrs
- 75.0%
Air-quality risk 2/10 · Minimal
- Unhealthy air days now
- 1 days/yr
- Unhealthy air days in 30 yrs
- 1 days/yr
Risk factors via First Street. Map © Google.
Why this score? — see what drove the B grade
The composite is a weighted blend of 9 inputs, each scored 0–100. Each bar is that input's sub-score; the figure is the points it added to the 100-point composite (weight × sub-score).
- Cash flow +30.0/30.0
- 1% rule +10.0/10.0
- DSCR +10.0/10.0
- ARV discount +7.5/15.0
- Appreciation +4.0/10.0
- Livability +2.9/5.0
- Rent growth +2.5/5.0
- Condition / age +2.5/5.0
- Schools +1.0/10.0
$35,000
🖨 Deal sheet 📄 Offer letter ✓ Due diligence
Listing remarks
Investor property in Louisville. Needs some TLC. Probate property. Has been rented in past 8 mos for $800 per seller.
Key facts
- 0.3 acre lot
- Garage
- Built 1959
Property features AI
Finance
- Other: Property type: Residential
Exterior
- Parking: Detached carport (1 carport space)
- Utilities: Utilities: Other
- Home design: Single-family residence; One-story entry level; One level / 1 story; Zoning: R3
- Construction: Shingle roof; Foundation: see remarks
- Exterior features: Screened front porch; Paved road access; Has a view; Lot dimensions approximately 129 x 88 x 130 x 88; Lot features: see remarks
Interior
- Bathrooms: 1 full bathroom
- Heating & cooling: No heating; No cooling
- Interior features: Total of 5 rooms; Screened front porch
Neighborhood map
What this means for you Summary
Snapshot
- This is a 3-bed/1.0-bath single-family listed at $35k.
Deal economics
- At list price, monthly cash flow is $599 ($7k/yr) — positive.
- The deal already cash-flows at list — no discount required.
- Meets the 1% rule at list price ($1k rent vs $35k).
Location & tenants
- Location reads 57/100 on livability (#471 in GA) — a working-class tenant base; expect higher turnover. Strengths: cost of living A+, housing A+, crime A-; Watch: amenities F, commute F, employment F.
- Jefferson County (rural): math 10% / reading 15% proficiency, ranked #166 of 174 in GA (top 95%) — low school quality limits family demand, transient renter base, plan for 1-2y turnover; 78% free/reduced lunch — lower-income household profile, screen leases tightly.
- Zoned schools: Louisville Academy (math 17% / reading 12%, grade F, #996 of 1,228 statewide, top 83%, 350 students, 100% FRL); Jefferson County Middle School (math 7% / reading 17%, grade F, #417 of 470 statewide, top 90%, 458 students, 100% FRL); Jefferson County High School (math 2% / reading 8%, grade F, #394 of 424 statewide, top 97%, 631 students, 100% FRL) — zoned schools average 100% FRL vs 78% district-wide (22 pts higher); higher-poverty schools than district average — tighter screening recommended.
- Market conditions: 27 active listings in the ZIP; 10 units permitted in Jefferson County in 2024 (0 in 5+ unit buildings).
Forward outlook
- Local home prices are declining (-2.0%/yr); year-one equity from $242 of loan paydown is wiped out by about $706 of value loss. Plan a longer hold.
- Jefferson County population projected at -31% by 2050 — secular population decline; favor cash flow + early exit over multi-decade hold.
- At projected returns (-2.0% appreciation + 3.0% rent growth), your $10k cash investment doubles in ~2 years — after that, you're playing with house money.
Negotiation context
- Only 5 days on market — expect competitive offers; lowballing is unlikely to land.
Risks & watch-outs
- Watch-outs: built in 1959 — expect roof / HVAC / electrical / plumbing capex.
- Climate carrying-cost: major wind risk, 75% chance of damaging wind over 30y; extreme-heat days projected 7→17/yr by 2055 (HVAC capex compounding) — expect insurance premiums to compound above CPI over the hold.
Questions for the listing agent
- Built in 1959 — when were the roof, HVAC, electrical panel, plumbing, and water heater last replaced?
- Is there a deadline driving the sale (1031 exchange, divorce, estate, relocation)? That informs how much negotiation room exists.
- Schools are F-rated, which usually means shorter tenancies and higher turnover. Who's the typical renter profile here, and what's been the actual vacancy rate?
- What's the average days-on-market for RENTAL listings here right now (not sales)? A rising rental-DOM trend means longer vacancies and softer asking-rent achievability than the comps imply.
- What's the recent tenant-quality profile in this submarket — average credit score on applications, eviction rate, late-payment / NSF rate, and stable-employment percentage? A property-management company in the area should have these aggregated.
- How much new for-sale + rental construction is in the pipeline within 1–3 miles? Heavy new supply typically softens prices + rents 12–24 months out; constrained supply supports both.
Investment metrics
- 1% rule
- 3.05% ✓
- Cap rate
- 26.82%
- Cash-on-cash
- 73.33%
- DSCR
- 4.26
- GRM
- 2.7
CMA / ARV
- ARV (on-the-fly)
- $144,966
- Comps found
- 2
Show comp detail 2 sales within ~0.75 mi
| Address | Dist | Beds/Ba | Sqft | Sold | Price | $/sf | Match |
|---|---|---|---|---|---|---|---|
| 1040 E Peachtree St | 0.60mi | 2/1.0 (-1) | 1,146 (-12%) | 13mo | $124,000 | $108 | 36 |
| 1014 Walnut St | 0.65mi | 3/2.0 | 1,462 (+12%) | 12mo | $163,000 | $111 | 36 |
Match score weights: distance 35% · size 25% · config 20% · recency 20%. Top-matched comps best support the ARV.
Projected returns pro-forma
-2.02% appreciation · 3.0% rent growth · sell at horizon
- IRR
- 73.9%
- Equity multiple
- 4.46×
- Total profit
- $33,949
- Equity at exit
- $6,774
- IRR
- 77.0%
- Equity multiple
- 9.17×
- Total profit
- $80,047
- Equity at exit
- $5,767
Cash invested: $9,800 (down + closing). Projections, not guarantees.
Landlord ↔ Tenant lean methodology
- Overall (STATE)
- 90 Strongly Landlord-Friendly
- State Georgia
- 90 Strongly Landlord-Friendly · R+3
- County
- — inherits STATE
- City
- — inherits STATE
ZIP-level market 30434
- Home prices YoY
- -1.3%
- Active inventory
- 27
- Price-to-rent
- 2.7×
Monthly cashflow live
- Estimated rent
- $1,067 medium interval (Pro) →
- Mortgage (P&I)
- −$184
- Tax from tax record
- −$46 /mo · $551/yr
- Insurance
- −$15
- HOA
- −$0
- Vacancy / Maint / Mgmt
- −$224
- Net cashflow
- $599
Break-even live
UW: 25.0% down · 7.5% · 30yr · 1.5% tax · 5.0% vac · 8.0% maint · 8.0% mgmt
Financing live
Cash to close
- Down payment
- $8,750
- Closing costs
- $1,050
- Reserves months
- —
- Total cash needed
- —
Loan-product check · same deal, 3 products live
Conventional
25% down · 7.5% · 30yr
- Down + closing
- —
- Monthly P&I
- —
- Monthly cashflow
- —
- DSCR
- —
- Eligible?
- —
Personal DTI + credit; lowest rate.
DSCR
20% down · 8.5% · 30yr
- Down + closing
- —
- Monthly P&I
- —
- Monthly cashflow
- —
- DSCR
- —
- Eligible?
- —
No personal income docs; deal must DSCR.
Hard money
10% down · 12.0% · 12mo
- Down + closing
- —
- Monthly P&I
- —
- Monthly cashflow
- —
- DSCR
- —
- Eligible?
- —
Short-term bridge; refi at stabilization.
Listing history 5 events
-
2026-06-02statusdays on market $35,000 Pending 5 DOM
-
2026-06-01days on market $35,000 Active 4 DOM
-
2026-05-31days on market $35,000 Active 3 DOM
-
2026-05-31days on market $35,000 Active 2 DOM
-
2026-05-28$35,000 Active
ⓘ Source: listings_history table (triggers on properties + properties_extension) + one-shot
backfill from property_details.listing_events for pre-trigger history.
Tax reassessment forecast GA · Resets to sale price
- Current annual tax
- $551 · $46/mo
- Projected year-2 tax
- $551 · $46/mo
- Expected delta
- $0/yr ($0/mo · 0.0%)
ⓘ Screening estimate from a state-policy table — verify with the county assessor before closing.
Climate risk First Street
- Flood 1/10 Low FEMA zone X (unshaded) · 0% chance over 30 yrs
- Wildfire 4/10 Moderate
- Heat 7/10 Severe 7 d/yr ≥109°F today · 17 d/yr by 30 yrs out
- Wind 7/10 Severe 75% chance of damaging wind over 30 yrs
- Air quality 2/10 Low 1 unhealthy d/yr today · 1 by 30 yrs out
Nearby sold comps map
Loading sold comps map…
Walkable amenities ~0.75 mi
Loading nearby amenities…
Taxation est. · year 1
- Rental income
- $12,803
- − Mortgage interest
- −$1,961
- − Property taxes
- −$551
- − Insurance
- −$175
- − Repairs & maintenance
- −$1,024
- − Management
- −$1,024
- − Depreciation
- −$1,018
- Taxable income
- $7,050
- Est. tax owed @ 24.0%
- −$1,692
- After-tax cash flow
- $5,494/yr
For passive investors: Depreciation is non-cash, so a rental often shows a tax loss while cash-flowing — sheltering income. Rental losses are passive: they offset passive income freely, and up to $25,000/yr can offset ordinary (W-2) income if you actively participate and your MAGI is under $100k (phasing out to $0 by $150k); unused losses carry forward. On sale, claimed depreciation is recaptured at up to 25%, and gains may owe capital-gains tax (a 1031 exchange can defer both). Figures are a year-1 estimate at your 24.0% rate — not tax advice; consult a CPA.
Schools (NCES district)
- District
- Jefferson County
- NCES district ID
- 1303060
- Math proficiency
- 10% ▼ -11.00%
- Reading proficiency
- 15% ▼ -8.00%
- Median HH income
- $28,884
- Composite
- 9.66/100
- National rank
- #9837
- State rank
- #166 of 174 in GA
Livability — Louisville
- Score
- 57/100
- State rank
- #471
- US rank
- #22201
Category grades
Schools grade is shown separately in the Schools card above.
Census & demographics
- Population (ZIP)
- 4,893
Population outlook (Jefferson County) Hauer SSP2
- Today (2025)
- 14,362 people
- By 2030
- 13,415 · -6.6%
- By 2040
- 11,559 · -19.5%
- By 2050
- 9,949 · -30.7%
- By 2075
- 7,040 · -51.0%
- By 2100
- 5,145 · -64.2%
Race, ethnicity, and origin ACS 2023
- Neighborhood character
- Predominantly Black (70%)
- Race & ethnicity
- Black 70% White 29% Two or more races 1%
- Common ancestry
- Slovak 1% Serbian 1% Lithuanian 1%
- Foreign-born
- 0%
Political lean MEDSL · Jefferson
- 2024 margin
- Toss-up / Even · D 49.2% · R 50.5%
- 2008→2024 swing
- -16.3pp toward R · 2008: 15.0pp · 2024: -1.2pp
- All cycles
- 2024: R+1.2 2020: D+6.8 2016: D+10.8 2012: D+17.1 2008: D+15.0
Not yet ingested
- Civics
- —
Market trends
- HPI YoY
- ▼ -2.02%
- Current HPI
- 153.1135
- Rent YoY
- —
- Metro
- —
- State GDP YoY
- ▲ 2.66%
- F500 in state
- 28
Industry mix (Fortune 500 HQ in GA)
| Industry | F500 HQs | Revenue |
|---|---|---|
| Paper / Packaging | 2 | $29B |
|
||
| Retail | 1 | $160B |
|
||
| Transportation / Logistics | 1 | $91B |
|
||
| Airlines | 1 | $62B |
|
||
| Consumer Goods | 1 | $47B |
|
||
| Utilities | 1 | $25B |
|
||
Price history
1 event — show timeline
- 2026-05-28 Listed $35,000 Hive MLS
Property tax history
+0.2%/yrLatest (2025): $551 · +400.7% YoY. Source: county tax records.
Cash-flow waterfall
monthlySold comps — $/sqft
last 12 mo · ≤1 miLoading sold comps…