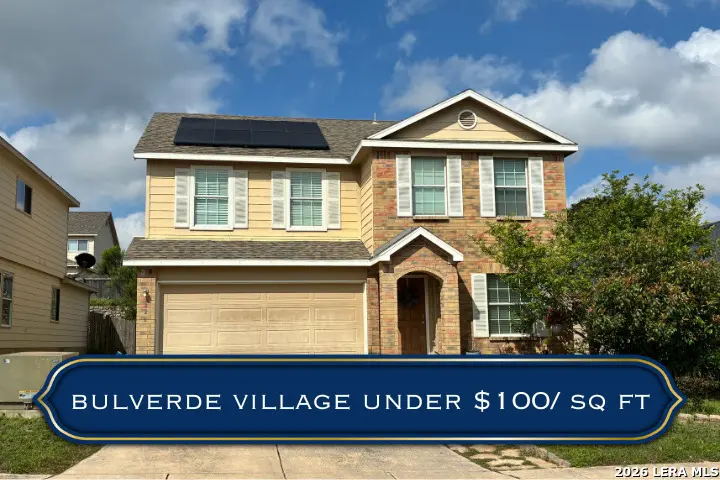
3926 Ashleaf Pecan
San Antonio, TX 78261
$255,000D+
4 bd · 2.5 ba ·
2,557 sqft ·
Built 2011
· SingleFamily
· Pending
· 1 DOM
Cashflow @ list (25.0% down · 7.5%)
Estimated rent
$2,413/mo
Mortgage (P&I)
−$1,337
Tax + insurance
−$652
HOA
−$49
Vac / Maint / Mgmt
−$507
Net cashflow
$-132/mo
Annual
$-1,581/yr
Cap rate
5.67%
Cash-on-cash
-2.21%
DSCR
0.90
1% rule
0.95%
Cash to close
$71,400
Investor read
- This is a 4-bed/2.5-bath single-family listed at $255k.
- At list price, monthly cash flow is $-132 ($-2k/yr) — negative.
- To cash-flow at today's rent, offer at most $232k (9.1% below list).
- To meet the 1% rule (rent ≥ 1% of price), the offer needs to be $241k (5.4% below list).
- Only 1 days on market — expect competitive offers; lowballing is unlikely to land.
- Recommended offer: $232k (9.1% below list) — sets the bar for cash-flow.
- Local home prices are declining (-3.0%/yr); year-one equity from $2k of loan paydown is wiped out by about $8k of value loss. Plan a longer hold.
- Location reads 80/100 on livability (#31 in TX, #1,616 nationally) — a professional / high-income tenant draw. Strengths: amenities A+, commute A+, cost of living A+; Watch: crime F.
- North East ISD (urban): math 38% / reading 49% proficiency, ranked #276 of 826 in TX (top 33%) — families likely to look elsewhere, expect single-tenant / working-renter base with shorter leases.
- Zoned schools: Cibolo Green (math 54% / reading 64%, grade B-, #455 of 4,322 statewide, top 11%, 834 students, 26% FRL); Hill Middle (math 51% / reading 64%, grade B, #206 of 1,662 statewide, top 13%, 1,044 students, 28% FRL); Johnson H S (math 69% / reading 80%, grade B+, #82 of 1,632 statewide, top 6%, 3,202 students, 24% FRL) — zoned schools average 26% FRL vs 41% district-wide (15 pts lower); this property's tenant base skews higher-income than the district average.
- Zoned-school proficiency averages 64% at this address vs 44% district-wide (+20 pts) — the actual schools serving this property are materially stronger than the North East ISD average implies; a family-tenant draw the district grade alone would hide.
- Watch-outs: property tax is 2.6% of price.
- Market conditions: Rents rising fast (+5.4%/yr); 247 active listings in the ZIP; 30 comparable units currently listed for rent nearby; rentals at typical pace (median 16d on market — plan ~3-4 weeks tenant-placement turnaround); high-income renter base; 8,308 units permitted in Bexar County in 2024 (2,506 in 5+ unit buildings).
- Bexar County population projected at +50% by 2050 — long-run rental-demand tailwind backs the buy-and-hold thesis.
- 4 sale attempts since 15y ago with the ask held roughly flat each time — persistent listings suggest the price (not the market) is what's stuck; bring a comps-based counter.
- Climate carrying-cost: major wind risk, 76% chance of damaging wind over 30y; extreme-heat days projected 7→23/yr by 2055 (HVAC capex compounding) — expect insurance premiums to compound above CPI over the hold.
- Cap rate 5.7% vs local median 3.8% in San Antonio — top-decile yield for the area; either an underpriced asset or a hidden risk that comps aren't pricing in. Stress-test before assuming the spread holds.
Questions for listing agent
- What do current leases actually rent for vs. the listed asking? Can we see a recent rent roll and the last 12 months of T-12 income?
- Property tax is high relative to price — has the assessment been appealed recently, and will the sale trigger a re-assessment?
- What does the HOA fee cover, when was the last increase, and are there any pending special assessments or reserve-fund shortfalls?
- Is there a deadline driving the sale (1031 exchange, divorce, estate, relocation)? That informs how much negotiation room exists.
- Crime grade is F in this area — have there been break-ins, vandalism, or insurance claims at this property in the last 3 years? What carrier currently insures it and at what premium?
- The area grade is low — what's the realistic commute time and amenity access for the typical tenant pool here? Any planned neighborhood developments (good or bad) we should know about?
- What's the average days-on-market for RENTAL listings here right now (not sales)? A rising rental-DOM trend means longer vacancies and softer asking-rent achievability than the comps imply.
- What's the recent tenant-quality profile in this submarket — average credit score on applications, eviction rate, late-payment / NSF rate, and stable-employment percentage? A property-management company in the area should have these aggregated.
CashFlowRE · CFR-W1Z39T8E4JVHJW
· Data 21 h ago
cashflowre.app · 2026-05-29