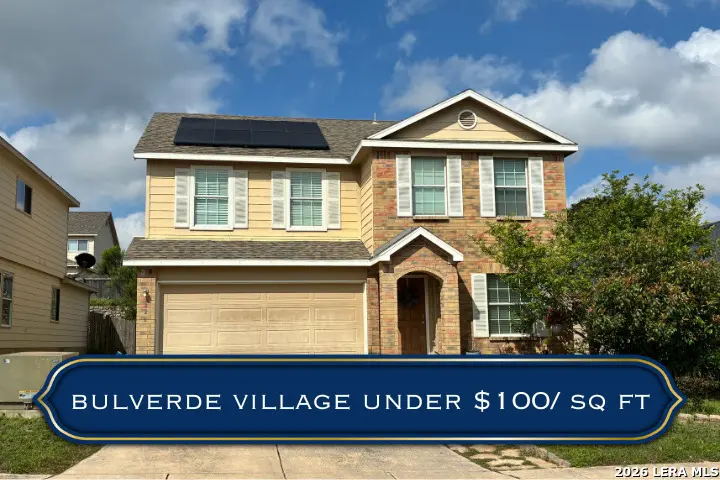
3926 Ashleaf Pecan · San Antonio, TX
Flood risk 1/10 · Minimal
- FEMA flood zone
- X (unshaded)
- Chance of flooding over 30 yrs
- 0.0%
- Est. flood insurance / yr
- $507 – $1,088
Fire risk 4/10 · Minor
- Est. fire insurance / yr
- $1,222 – $2,270
Heat risk 8/10 · Major
- Hot days now (above 106°F)
- 7 days/yr
- Hot days in 30 yrs
- 23 days/yr
Wind risk 6/10 · Moderate
- Chance of severe wind over 30 yrs
- 76.0%
Air-quality risk 2/10 · Minimal
- Unhealthy air days now
- 1 days/yr
- Unhealthy air days in 30 yrs
- 1 days/yr
Risk factors via First Street. Map © Google.
Why this score? — see what drove the D+ grade
The composite is a weighted blend of 9 inputs, each scored 0–100. Each bar is that input's sub-score; the figure is the points it added to the 100-point composite (weight × sub-score).
- ARV discount +15.0/15.0
- Cash flow +10.5/30.0
- 1% rule +4.5/10.0
- Livability +4.0/5.0
- Rent growth +3.8/5.0
- Schools +3.8/10.0
- DSCR +3.0/10.0
- Condition / age +2.5/5.0
- Appreciation +0.0/10.0
$255,000
🖨 Deal sheet (PDF) 📄 Offer letter ✓ Due diligence
Listing remarks MLS
This home has an incredible lay out! With the master bedroom downstairs and 3 bedrooms, an office and a loft upstairs the functionality is ideal. 3 living areas including the loft/game room. Wonderful neighborhood hosts several social events throughout the year. No City Tax! Excellent NEISD schools including Cibolo Green elementary, Tex Hill middle school, and Johnson High! Neighborhood walking trails, park, and sports courts are well maintained and within walking distance. Incredible potential!
Key facts
- 5,183 sq ft lot
- 2 garage spots
- Built 2011
Property features AI
Finance
- Other: Possession at closing/funding; For sale
- Financial info: Down payment assistance not indicated
- HOA & community: Mandatory HOA (multiple HOAs); HOA fee(s) semi-annually; Association transfer fee applies; Neighborhood amenities include a park/playground
Exterior
- Parking: Attached 2-car garage
- Utilities: City water system; Electric power; City sewer (implied by city water entry)
- Home design: Pre-owned single-family home; Front exposure facing east; Subdivision: BULVERDE VILLAGE
- Construction: Approximately 15 years old; Built by Centex; Brick and 4-sided masonry exterior with cement fiber accents; Slab foundation; Composition roof
- Exterior features: Privacy fence; Level lot; Street paved with curbs, sidewalks and streetlights
Interior
- Kitchen: Stove/Range; Dishwasher; Eat-in kitchen; Breakfast bar
- Bedrooms: Master bedroom on lower level with walk-in closet; Bedroom 2: 12 x 12; Bedroom 3: 11 x 11; Bedroom 4: 15 x 11; Master bedroom: 16 x 15
- Flooring: Laminate flooring
- Bathrooms: No baths listed
- Heating & cooling: Central heating (electric); Central air conditioning (1 unit)
- Interior features: Three living areas; Separate dining room; Eat-in kitchen with breakfast bar; Two eating areas; Study/Library; Game room; Utility room inside; Laundry on main level; Walk-in closets; All window coverings remain; Private garbage service; Water softener (owned); Electric water heater
- Laundry & utility: Washer connection; Dryer connection; Laundry on main level; Utility room inside (8 x 6)
Neighborhood map
What this means for you Summary
Snapshot
- This is a 4-bed/2.5-bath single-family listed at $255k.
Deal economics
- At list price, monthly cash flow is $-132 ($-2k/yr) — negative.
- To cash-flow at today's rent, offer at most $232k (9.1% below list).
- To meet the 1% rule (rent ≥ 1% of price), the offer needs to be $241k (5.4% below list).
- Recommended offer: $232k (9.1% below list) — sets the bar for cash-flow.
- Cap rate 5.7% vs local median 3.8% in San Antonio — top-decile yield for the area; either an underpriced asset or a hidden risk that comps aren't pricing in. Stress-test before assuming the spread holds.
Location & tenants
- Location reads 80/100 on livability (#31 in TX, #1,616 nationally) — a professional / high-income tenant draw. Strengths: amenities A+, commute A+, cost of living A+; Watch: crime F.
- North East ISD (urban): math 38% / reading 49% proficiency, ranked #276 of 826 in TX (top 33%) — families likely to look elsewhere, expect single-tenant / working-renter base with shorter leases.
- Zoned schools: Cibolo Green (math 54% / reading 64%, grade B-, #455 of 4,322 statewide, top 11%, 834 students, 26% FRL); Hill Middle (math 51% / reading 64%, grade B, #206 of 1,662 statewide, top 13%, 1,044 students, 28% FRL); Johnson H S (math 69% / reading 80%, grade B+, #82 of 1,632 statewide, top 6%, 3,202 students, 24% FRL) — zoned schools average 26% FRL vs 41% district-wide (15 pts lower); this property's tenant base skews higher-income than the district average.
- Zoned-school proficiency averages 64% at this address vs 44% district-wide (+20 pts) — the actual schools serving this property are materially stronger than the North East ISD average implies; a family-tenant draw the district grade alone would hide.
- Market conditions: Rents rising fast (+5.4%/yr); 247 active listings in the ZIP; 30 comparable units currently listed for rent nearby; rentals at typical pace (median 16d on market — plan ~3-4 weeks tenant-placement turnaround); high-income renter base; 8,308 units permitted in Bexar County in 2024 (2,506 in 5+ unit buildings).
Forward outlook
- Local home prices are declining (-3.0%/yr); year-one equity from $2k of loan paydown is wiped out by about $8k of value loss. Plan a longer hold.
- Bexar County population projected at +50% by 2050 — long-run rental-demand tailwind backs the buy-and-hold thesis.
Negotiation context
- Only 1 days on market — expect competitive offers; lowballing is unlikely to land.
- 4 sale attempts since 15y ago with the ask held roughly flat each time — persistent listings suggest the price (not the market) is what's stuck; bring a comps-based counter.
Risks & watch-outs
- Watch-outs: property tax is 2.6% of price.
- Climate carrying-cost: major wind risk, 76% chance of damaging wind over 30y; extreme-heat days projected 7→23/yr by 2055 (HVAC capex compounding) — expect insurance premiums to compound above CPI over the hold.
Questions for the listing agent
- What do current leases actually rent for vs. the listed asking? Can we see a recent rent roll and the last 12 months of T-12 income?
- Property tax is high relative to price — has the assessment been appealed recently, and will the sale trigger a re-assessment?
- What does the HOA fee cover, when was the last increase, and are there any pending special assessments or reserve-fund shortfalls?
- Is there a deadline driving the sale (1031 exchange, divorce, estate, relocation)? That informs how much negotiation room exists.
- Crime grade is F in this area — have there been break-ins, vandalism, or insurance claims at this property in the last 3 years? What carrier currently insures it and at what premium?
- The area grade is low — what's the realistic commute time and amenity access for the typical tenant pool here? Any planned neighborhood developments (good or bad) we should know about?
- What's the average days-on-market for RENTAL listings here right now (not sales)? A rising rental-DOM trend means longer vacancies and softer asking-rent achievability than the comps imply.
- What's the recent tenant-quality profile in this submarket — average credit score on applications, eviction rate, late-payment / NSF rate, and stable-employment percentage? A property-management company in the area should have these aggregated.
- How much new for-sale + rental construction is in the pipeline within 1–3 miles? Heavy new supply typically softens prices + rents 12–24 months out; constrained supply supports both.
Investment metrics
- 1% rule
- 0.95% ✗
- Cap rate
- 5.67%
- Cash-on-cash
- -2.21%
- DSCR
- 0.90
- GRM
- 8.8
CMA / ARV
- ARV (on-the-fly)
- $427,019
- Comps found
- 12
Show comp detail 12 sales within ~0.75 mi
| Address | Dist | Beds/Ba | Sqft | Sold | Price | $/sf | Match |
|---|---|---|---|---|---|---|---|
| 3926 Arrowwood Bnd | 0.10mi | 4/2.5 | 2,557 (0%) | 0mo | $319,999 | $125 | 95 |
| 24215 Desert Ash | 0.10mi | 4/3.0 | 2,614 (+2%) | 2mo | $375,000 | $143 | 88 |
| 24207 Bitter Crimson | 0.17mi | 4/2.5 | 2,472 (-3%) | 2mo | $319,900 | $129 | 85 |
| 24707 Magnolia Fls | 0.36mi | 5/2.5 (+1) | 2,556 (-0%) | 1mo | $299,000 | $117 | 77 |
| 3707 Eliberis | 0.56mi | 4/3.5 | 2,521 (-1%) | 2mo | $535,000 | $212 | 66 |
| 24620 Ahava | 0.39mi | 4/3.0 | 2,320 (-9%) | 2mo | $459,900 | $198 | 63 |
| 23204 Fossil Peak | 0.45mi | 3/2.5 (-1) | 2,723 (+6%) | 1mo | $650,000 | $239 | 62 |
| 3734 Arrowwood | 0.18mi | 3/2.5 (-1) | 2,196 (-14%) | 1mo | $305,000 | $139 | 62 |
| 24050 Waterhole Ln | 0.72mi | 4/2.5 | 2,661 (+4%) | 1mo | $405,000 | $152 | 59 |
| 24118 Briarbrook | 0.63mi | 4/2.5 | 2,739 (+7%) | 1mo | $458,500 | $167 | 58 |
| 24814 Las Pilas | 0.54mi | 4/2.5 | 2,802 (+10%) | 2mo | $500,000 | $178 | 57 |
| 24608 Ahava | 0.42mi | 4/3.5 | 2,899 (+13%) | 2mo | $549,900 | $190 | 53 |
Match score weights: distance 35% · size 25% · config 20% · recency 20%. Top-matched comps best support the ARV.
Projected returns pro-forma
-3.0% appreciation · 5.37% rent growth · sell at horizon
- IRR
- -16.8%
- Equity multiple
- 0.39×
- Total profit
- $-43,615
- Equity at exit
- $38,021
- IRR
- -4.3%
- Equity multiple
- 0.68×
- Total profit
- $-22,573
- Equity at exit
- $22,048
Cash invested: $71,400 (down + closing). Projections, not guarantees.
Landlord ↔ Tenant lean methodology
- Overall (STATE)
- 87 Strongly Landlord-Friendly
- State Texas
- 87 Strongly Landlord-Friendly · R+5
- County
- — inherits STATE
- City
- — inherits STATE
ZIP-level market 78261
- Home prices YoY
- -15.0%
- Rents YoY
- 5.4%
- Active inventory
- 247
- Price-to-rent
- 8.8×
Monthly cashflow live
- Estimated rent
- $2,413 high interval (Pro) →
- Mortgage (P&I)
- −$1,337
- Tax from tax record
- −$546 /mo · $6,548/yr
- Insurance
- −$106
- HOA
- −$49
- Vacancy / Maint / Mgmt
- −$507
- Net cashflow
- $-132
Break-even live
Sensitivity live
| Price | -10% $13 | -5% $-60 | +0% $-132 | +5% $-204 | +10% $-276 |
|---|---|---|---|---|---|
| Rent | -10% $-322 | -5% $-227 | +0% $-132 | +5% $-36 | +10% $59 |
| Rate | -1.0pp $-3 | -0.5pp $-67 | base $-132 | +0.5pp $-198 | +1.0pp $-265 |
UW: 25.0% down · 7.5% · 30yr · 1.5% tax · 5.0% vac · 8.0% maint · 8.0% mgmt
Financing live
Cash to close
- Down payment
- $63,750
- Closing costs
- $7,650
- Reserves months
- —
- Total cash needed
- —
Loan-product check · same deal, 3 products live
Conventional
25% down · 7.5% · 30yr
- Down + closing
- —
- Monthly P&I
- —
- Monthly cashflow
- —
- DSCR
- —
- Eligible?
- —
Personal DTI + credit; lowest rate.
DSCR
20% down · 8.5% · 30yr
- Down + closing
- —
- Monthly P&I
- —
- Monthly cashflow
- —
- DSCR
- —
- Eligible?
- —
No personal income docs; deal must DSCR.
Hard money
10% down · 12.0% · 12mo
- Down + closing
- —
- Monthly P&I
- —
- Monthly cashflow
- —
- DSCR
- —
- Eligible?
- —
Short-term bridge; refi at stabilization.
Rent comps 30 comps
| Address | Beds | Baths | Sqft | Rent | $/sqft | DOM | Units | Dist |
|---|---|---|---|---|---|---|---|---|
| 24314 Invitation Oak San Antonio, TX | 4.0 | 2.5 | 2427 | $2,100 | $0.87 | 25d | 1 | 0.15mi |
| 24618 Hickory Mdw San Antonio, TX | 4.0 | 2.5 | 2330 | $2,300 | $0.99 | 11d | 1 | 0.25mi |
| 24710 Hickory Mdw San Antonio, TX | 4.0 | 2.5 | 2556 | $2,297 | $0.90 | 13d | 1 | 0.25mi |
| 3827 Ponderosa Bnd San Antonio, TX | 3.0 | 2.0 | 1945 | $1,850 | $0.95 | 23d | 1 | 0.26mi |
| 3722 Longhorn Crk San Antonio, TX | 3.0 | 2.5 | 1808 | $1,895 | $1.05 | 0d | 1 | 0.27mi |
| 3803 Ponderosa Bnd San Antonio, TX | 5.0 | 2.5 | 2557 | $2,375 | $0.93 | 0d | 1 | 0.31mi |
| 24618 Magnolia Fls San Antonio, TX | 4.0 | 2.5 | 2556 | $2,100 | $0.82 | 25d | 1 | 0.34mi |
| 25208 Cambridge Wl San Antonio, TX | 4.0 | 2.5 | 2104 | $2,050 | $0.97 | 15d | 1 | 0.56mi |
| 25023 Las Pilas San Antonio, TX | 4.0 | 3.0 | 3043 | $3,400 | $1.12 | 0d | 1 | 0.58mi |
| 3814 Flyer Vis San Antonio, TX | 3.0 | 2.5 | 1811 | $2,250 | $1.24 | 45d | 1 | 0.60mi |
| 3527 Grace Way San Antonio, TX | 5.0 | 4.0 | 3027 | $3,600 | $1.19 | 45d | 1 | 0.61mi |
| 25322 Longbranch Run San Antonio, TX | 3.0 | 2.5 | 1808 | $1,940 | $1.07 | 21d | 1 | 0.64mi |
| 25346 Colt Riv San Antonio, TX | 3.0 | 2.5 | 2104 | $2,299 | $1.09 | 4d | 1 | 0.66mi |
| 24103 Briarbrook Way San Antonio, TX | 4.0 | 3.5 | 3621 | $3,500 | $0.97 | 5d | 1 | 0.67mi |
| 3638 Bennington Way San Antonio, TX | 4.0 | 2.5 | 2309 | $2,450 | $1.06 | 25d | 1 | 0.68mi |
| 24914 Resort Pkwy San Antonio, TX | 4.0 | 3.0 | 2521 | $3,300 | $1.31 | 45d | 1 | 0.68mi |
| 3623 Bennington Way San Antonio, TX | 3.0 | 2.0 | 1970 | $2,100 | $1.07 | 45d | 1 | 0.70mi |
| 4092 Tpc Pkwy San Antonio, TX | 1.0–4.0 | 1.0–4.0 | 1251 | $2,586 | $2.07 | 0d | 29 | 0.72mi |
| 3638 Sumantra Clf San Antonio, TX | 4.0 | 2.0 | 2648 | $2,395 | $0.90 | 0d | 1 | 0.73mi |
| 3702 Sumantra Clf San Antonio, TX | 4.0 | 2.5 | 2518 | $2,500 | $0.99 | 0d | 1 | 0.74mi |
| 3815 Bennington Way San Antonio, TX | 3.0 | 2.0 | 1761 | $2,150 | $1.22 | 19d | 1 | 0.75mi |
| 25447 Longbranch Run San Antonio, TX | 4.0 | 3.0 | 2044 | $2,200 | $1.08 | 0d | 1 | 0.75mi |
| 3306 Brooktree Ct San Antonio, TX | 4.0 | 3.5 | 2899 | $2,889 | $1.00 | 25d | 1 | 0.80mi |
| 24062 Sidehill Lie San Antonio, TX | 3.0 | 2.0 | 2201 | $4,000 | $1.82 | 5d | 1 | 0.81mi |
| 3630 Cotoneaster San Antonio, TX | 5.0 | 3.0 | 2695 | $3,000 | $1.11 | 0d | 1 | 0.90mi |
| 25839 Big Bluestem San Antonio, TX | 4.0 | 2.5 | 2966 | $2,700 | $0.91 | 6d | 1 | 1.20mi |
| 3338 Bending Crk San Antonio, TX | 5.0 | 3.5 | 3554 | $3,200 | $0.90 | 45d | 1 | 1.21mi |
| 3734 Ox-Eye Daisy San Antonio, TX | 4.0 | 2.5 | 3089 | $2,797 | $0.91 | 0d | 1 | 1.27mi |
| 3610 Sweet Olive San Antonio, TX | 3.0 | 2.0 | 1839 | $2,150 | $1.17 | 19d | 1 | 1.29mi |
| 23010 Diamante San Antonio, TX | 3.0 | 2.0 | 2300 | $3,650 | $1.59 | 25d | 1 | 1.42mi |
HOA detail
- Monthly dues
- $49 · $588/yr
Listing history 2 events
-
2026-06-08remarks 699-char remark
-
2026-06-08$255,000 Pending 1 DOM
ⓘ Source: listings_history table (triggers on properties + properties_extension) + one-shot
backfill from property_details.listing_events for pre-trigger history.
Tax reassessment forecast TX · Resets to sale price
- Current annual tax
- $6,548 · $546/mo
- Projected year-2 tax
- $6,548 · $546/mo
- Expected delta
- $0/yr ($0/mo · 0.0%)
ⓘ Screening estimate from a state-policy table — verify with the county assessor before closing.
Climate risk First Street
- Flood 1/10 Low FEMA zone X (unshaded) · 0% chance over 30 yrs
- Wildfire 4/10 Moderate
- Heat 8/10 Severe 7 d/yr ≥106°F today · 23 d/yr by 30 yrs out
- Wind 6/10 Major 76% chance of damaging wind over 30 yrs
- Air quality 2/10 Low 1 unhealthy d/yr today · 1 by 30 yrs out
Nearby sold comps map
Loading sold comps map…
Walkable amenities ~0.75 mi
Loading nearby amenities…
Taxation est. · year 1
- Rental income
- $28,958
- − Mortgage interest
- −$14,284
- − Property taxes
- −$6,548
- − Insurance
- −$1,275
- − Repairs & maintenance
- −$2,317
- − Management
- −$2,317
- − HOA
- −$588
- − Depreciation
- −$7,418
- Taxable loss
- −$5,788
- Est. tax savings @ 24.0%
- +$1,389
- After-tax cash flow
- $-192/yr
For passive investors: Depreciation is non-cash, so a rental often shows a tax loss while cash-flowing — sheltering income. Rental losses are passive: they offset passive income freely, and up to $25,000/yr can offset ordinary (W-2) income if you actively participate and your MAGI is under $100k (phasing out to $0 by $150k); unused losses carry forward. On sale, claimed depreciation is recaptured at up to 25%, and gains may owe capital-gains tax (a 1031 exchange can defer both). Figures are a year-1 estimate at your 24.0% rate — not tax advice; consult a CPA.
Schools (NCES district)
- District
- North East ISD
- NCES district ID
- 4832940
- Math proficiency
- 38% ▼ -14.00%
- Reading proficiency
- 49% ▼ -4.00%
- Median HH income
- $57,715
- Composite
- 38.1/100
- National rank
- #4276
- State rank
- #276 of 826 in TX
Livability — San Antonio
- Score
- 80/100
- State rank
- #31
- US rank
- #1616
Category grades
Schools grade is shown separately in the Schools card above.
Census & demographics
- County
- Bexar County · 1,990,555 people
- City population
- 1,806,925
- Metro
- San Antonio-New Braunfels, TX
- Population (ZIP)
- 26,657
- Household income
- $147,727
- Rent vs Own
- Severe rent burden
- 257.0
Population outlook (Bexar County) Hauer SSP2
- Today (2025)
- 2,336,851 people
- By 2030
- 2,560,728 · +9.6%
- By 2040
- 3,020,569 · +29.3%
- By 2050
- 3,493,522 · +49.5%
- By 2075
- 4,668,459 · +99.8%
- By 2100
- 5,533,242 · +136.8%
Race, ethnicity, and origin ACS 2023
- Neighborhood character
- Diverse neighborhood (Simpson 0.67)
- Race & ethnicity
- White 43% Hispanic / Latino 36% Two or more races 25% Black 9% Asian 5% Native American 1%
- Hispanic origin (detail)
- Mexican 30% Puerto Rican 1%
- Common ancestry
- Lithuanian 3% Romanian 2% Italian 2%
- Foreign-born
- 12% · Canada, Jamaica, South Korea
- Languages at home
- 74% English-only · Spanish 17% Other Indo-European 3% Russian/Polish/Slavic 3%
Political lean MEDSL · Bexar
- 2024 margin
- Lean D (+9.8) · D 54.3% · R 44.6% · Other 1.1%
- 2008→2024 swing
- +4.2pp toward D · 2008: 5.6pp · 2024: 9.8pp
- All cycles
- 2024: D+9.8 2020: D+18.2 2016: D+13.5 2012: D+4.6 2008: D+5.6
Not yet ingested
- Civics
- —
Market trends
- HPI YoY
- ▼ -40.32%
- Current HPI
- 227.8859
- Rent YoY
- ▲ 5.37%
- Metro
- San Antonio-New Braunfels, TX
- State GDP YoY
- ▲ 3.95%
- F500 in state
- 110
Industry mix (Fortune 500 HQ in TX)
| Industry | F500 HQs | Revenue |
|---|---|---|
| Energy | 16 | $1,198B |
|
||
| Technology | 5 | $198B |
|
||
| Engineering / Construction | 4 | $72B |
|
||
| Energy Services | 3 | $60B |
|
||
| Utilities | 3 | $41B |
|
||
| Healthcare | 2 | $330B |
|
||
Price history
+48.1% since first listed12 events — show timeline
- 2026-06-07 Pending — LERA
- 2026-05-25 Listed $255,000 LERA
- 2018-11-30 Sold (Public Records) — Public Records
- 2018-11-28 Sold (MLS) — LERA
- 2018-11-15 Pending — LERA
- 2018-10-15 Contingent — LERA
- 2018-10-05 Listed $219,000 LERA
- 2012-06-28 Sold (MLS) — LERA
- 2012-03-26 Listing Removed — LERA
- 2012-02-15 Listed $174,990 LERA
- 2011-11-09 Listing Removed — LERA
- 2011-10-13 Listed $172,189 LERA
Property tax history
+23.0%/yrLatest (2025): $6,548 · -1.8% YoY. Source: county tax records.
Cash-flow waterfall
monthlySold comps — $/sqft
last 12 mo · ≤1 miLoading sold comps…