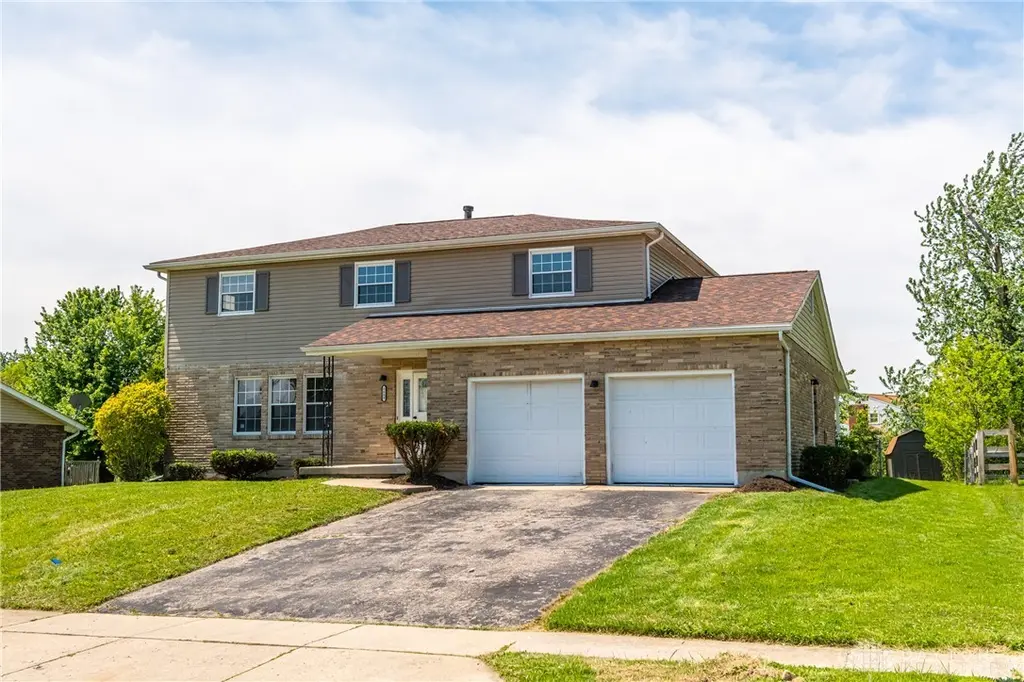
5689 Westcreek Dr
Trotwood, OH 45426
$259,900D-
4 bd · 2.5 ba ·
2,304 sqft ·
Built 1970
· SingleFamily
· Pending
· 2 DOM
Cashflow @ list (25.0% down · 7.5%)
Estimated rent
$2,373/mo
Mortgage (P&I)
−$1,363
Tax + insurance
−$553
HOA
−$0
Vac / Maint / Mgmt
−$498
Net cashflow
$-42/mo
Annual
$-500/yr
Cap rate
6.10%
Cash-on-cash
-0.69%
DSCR
0.97
1% rule
0.91%
Cash to close
$72,772
Investor read
- This is a 4-bed/2.5-bath single-family listed at $260k.
- At list price, monthly cash flow is $-42 ($-500/yr) — negative.
- To cash-flow at today's rent, offer at most $253k (2.8% below list).
- To meet the 1% rule (rent ≥ 1% of price), the offer needs to be $237k (8.7% below list).
- Only 2 days on market — expect competitive offers; lowballing is unlikely to land.
- Recommended offer: $237k (8.7% below list) — sets the bar for 1% rule.
- Local home prices are declining (-3.0%/yr); year-one equity from $2k of loan paydown is wiped out by about $8k of value loss. Plan a longer hold.
- Location reads 59/100 on livability (#1,014 in OH) — a working-class tenant base; expect higher turnover. Strengths: cost of living A+, housing A; Watch: employment D, crime F, amenities F.
- Trotwood-Madison City (suburban): math 9% / reading 21% proficiency, ranked #645 of 656 in OH (top 98%) — low school quality limits family demand, transient renter base, plan for 1-2y turnover; 78% free/reduced lunch — lower-income household profile, screen leases tightly.
- Zoned schools: Trotwood-Madison Early Learning Center (416 students, 0% FRL); Trotwood-Madison Middle School (math 8% / reading 18%, grade F, #640 of 654 statewide, top 98%, 608 students, 0% FRL); Trotwood-Madison High School (math 2% / reading 27%, grade F, #717 of 781 statewide, top 92%, 770 students, 0% FRL) — zoned schools average 0% FRL vs 78% district-wide (78 pts lower); this property's tenant base skews higher-income than the district average.
- Market conditions: 49 active listings in the ZIP; 5 comparable units currently listed for rent nearby; rentals leasing fast (median 5d on market — plan ~1-2 weeks tenant-placement turnaround); 907 units permitted in Montgomery County in 2024 (416 in 5+ unit buildings).
- Montgomery County population projected at -10% by 2050 — secular population decline; favor cash flow + early exit over multi-decade hold.
- Current owner paid $100k; list at $260k implies a 160% gain — meaningful room to come down on a strong offer.
- At $2,373/mo this rent would consume 55% of the median local household income ($52k/yr) (locally 852% of renters already pay >50% of income on rent) — very limited rent-growth headroom before tenants either downsize or default.
Questions for listing agent
- What do current leases actually rent for vs. the listed asking? Can we see a recent rent roll and the last 12 months of T-12 income?
- Built in 1970 — when were the roof, HVAC, electrical panel, plumbing, and water heater last replaced?
- Is there a deadline driving the sale (1031 exchange, divorce, estate, relocation)? That informs how much negotiation room exists.
- Schools are F-rated, which usually means shorter tenancies and higher turnover. Who's the typical renter profile here, and what's been the actual vacancy rate?
- Crime grade is F in this area — have there been break-ins, vandalism, or insurance claims at this property in the last 3 years? What carrier currently insures it and at what premium?
- The area grade is low — what's the realistic commute time and amenity access for the typical tenant pool here? Any planned neighborhood developments (good or bad) we should know about?
- What's the average days-on-market for RENTAL listings here right now (not sales)? A rising rental-DOM trend means longer vacancies and softer asking-rent achievability than the comps imply.
- What's the recent tenant-quality profile in this submarket — average credit score on applications, eviction rate, late-payment / NSF rate, and stable-employment percentage? A property-management company in the area should have these aggregated.
CashFlowRE · CFR-W288VD5V279GB4
· Data 4 weeks ago
cashflowre.app · 2026-05-29