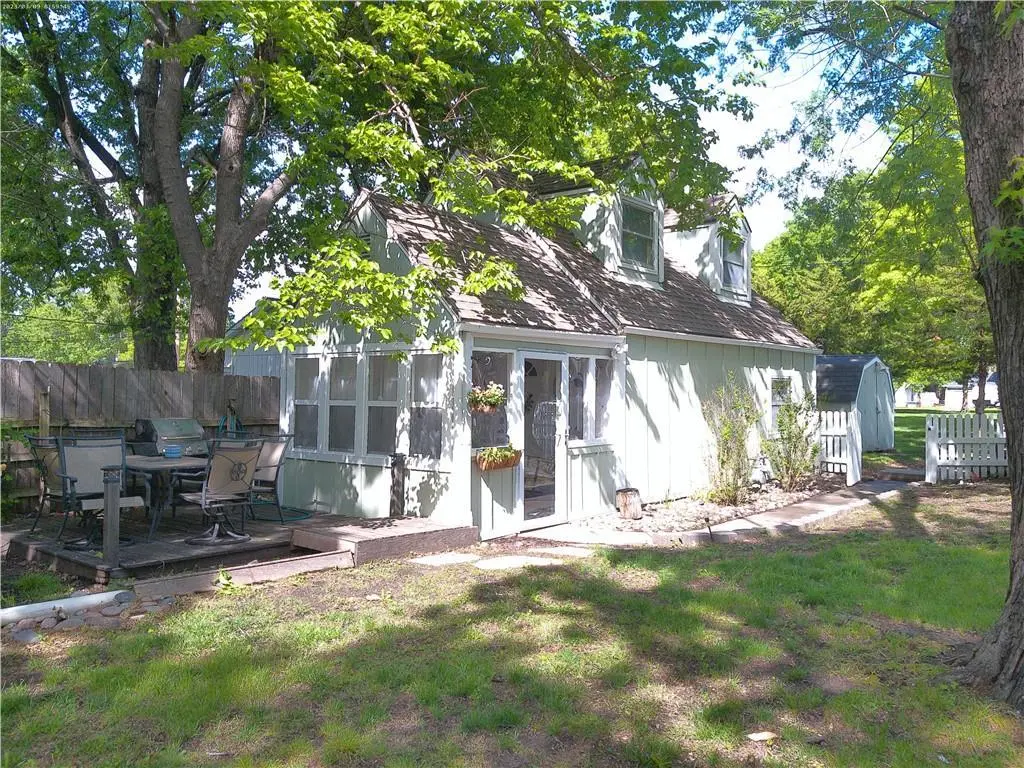
433 S Willow St
Ottawa, KS 66067
$99,500C+
2 bd · 1.0 ba ·
586 sqft ·
Built 1930
· SingleFamily
· Pending
· 3 DOM
Cashflow @ list (25.0% down · 7.5%)
Estimated rent
$1,225/mo
Mortgage (P&I)
−$522
Tax + insurance
−$136
HOA
−$0
Vac / Maint / Mgmt
−$257
Net cashflow
$310/mo
Annual
$3,717/yr
Cap rate
10.03%
Cash-on-cash
13.34%
DSCR
1.59
1% rule
1.23%
Cash to close
$27,860
Investor read
- This is a 2-bed/1.0-bath single-family listed at $100k.
- At list price, monthly cash flow is $310 ($4k/yr) — positive.
- The deal already cash-flows at list — no discount required.
- Meets the 1% rule at list price ($1k rent vs $100k).
- Only 3 days on market — expect competitive offers; lowballing is unlikely to land.
- Local home prices are declining (-3.0%/yr); year-one equity from $688 of loan paydown is wiped out by about $3k of value loss. Plan a longer hold.
- Location reads 72/100 on livability (#125 in KS) — a middle-class / working-renter tenant base. Strengths: cost of living A+, housing A+, health & safety A+; Watch: employment D+, amenities F, commute F.
- Ottawa (town): math 23% / reading 30% proficiency, ranked #128 of 169 in KS (top 76%) — low school quality limits family demand, transient renter base, plan for 1-2y turnover.
- Zoned schools: Ottawa Sr High (math 8% / reading 17%, grade F, #278 of 327 statewide, top 86%, 727 students, 51% FRL) — zoned schools at 51% FRL track the district average.
- Zoned-school proficiency averages 12% at this address vs 26% district-wide (-14 pts) — the specific schools serving this property underperform the Ottawa average; the district grade overstates school quality for this exact location.
- Watch-outs: built in 1930 — expect roof / HVAC / electrical / plumbing capex.
- Market conditions: 106 active listings in the ZIP; 1 comparable units currently listed for rent nearby; 85 units permitted in Franklin County in 2024 (0 in 5+ unit buildings).
- Franklin County population projected at -17% by 2050 — secular population decline; favor cash flow + early exit over multi-decade hold.
- 4 sale attempts since 12y ago with the ask held roughly flat each time — persistent listings suggest the price (not the market) is what's stuck; bring a comps-based counter.
- Current owner paid $57k; list at $100k implies a 74% gain — meaningful room to come down on a strong offer.
- At projected returns (-3.0% appreciation + 3.0% rent growth), your $28k cash investment doubles in ~9 years — after that, you're playing with house money.
Questions for listing agent
- Built in 1930 — when were the roof, HVAC, electrical panel, plumbing, and water heater last replaced?
- Is there a deadline driving the sale (1031 exchange, divorce, estate, relocation)? That informs how much negotiation room exists.
- Schools are F-rated, which usually means shorter tenancies and higher turnover. Who's the typical renter profile here, and what's been the actual vacancy rate?
- What's the average days-on-market for RENTAL listings here right now (not sales)? A rising rental-DOM trend means longer vacancies and softer asking-rent achievability than the comps imply.
- What's the recent tenant-quality profile in this submarket — average credit score on applications, eviction rate, late-payment / NSF rate, and stable-employment percentage? A property-management company in the area should have these aggregated.
- How much new for-sale + rental construction is in the pipeline within 1–3 miles? Heavy new supply typically softens prices + rents 12–24 months out; constrained supply supports both.
CashFlowRE · CFR-W3CPBYAY5WPFE0
· Data 3 weeks ago
cashflowre.app · 2026-05-29