433 S Willow St · Ottawa, KS
Flood risk 1/10 · Minimal
- FEMA flood zone
- X (unshaded)
- Chance of flooding over 30 yrs
- 0.0%
- Est. flood insurance / yr
- $507 – $1,088
Fire risk 2/10 · Minimal
- Est. fire insurance / yr
- $1,154 – $2,142
Heat risk 4/10 · Minor
- Hot days now (above 108°F)
- 7 days/yr
- Hot days in 30 yrs
- 17 days/yr
Wind risk 2/10 · Minimal
- Chance of severe wind over 30 yrs
- —
Air-quality risk 2/10 · Minimal
- Unhealthy air days now
- 1 days/yr
- Unhealthy air days in 30 yrs
- 1 days/yr
Risk factors via First Street. Map © Google.
Why this score? — see what drove the C+ grade
The composite is a weighted blend of 9 inputs, each scored 0–100. Each bar is that input's sub-score; the figure is the points it added to the 100-point composite (weight × sub-score).
- Cash flow +28.0/30.0
- DSCR +9.9/10.0
- ARV discount +7.5/15.0
- 1% rule +7.3/10.0
- Livability +3.6/5.0
- Rent growth +2.5/5.0
- Condition / age +2.5/5.0
- Schools +2.3/10.0
- Appreciation +0.0/10.0
$99,500
🖨 Deal sheet 📄 Offer letter ✓ Due diligence
Listing remarks MLS
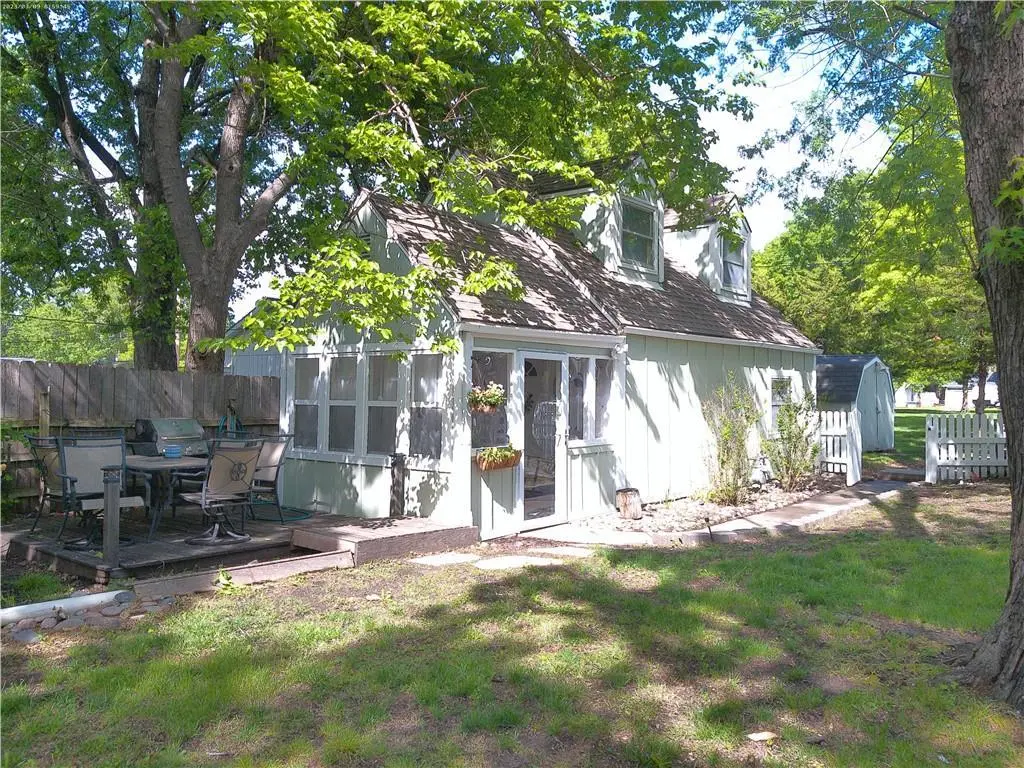
Quaint Rental on a large corner lot! Term Tenant. .. Rent could be increased. Currently Rents for $500/mo.
Key facts
- White picket fence
- Enclosed porch
- Tree shaded deck
Tags
Property features AI
Finance
- Other: Approximately 704 above-grade living area (public records); Not in a flood plain
- HOA & community: No association fees
Exterior
- Parking: Off-street parking
- Utilities: Public water; Public sewer
- Home design: Single family residence; Residential property; 1.5-story floor plan; Faces south
- Construction: Frame construction; Composition roof; Slab foundation; Approximately 76–100 years old
- Exterior features: Deck; Wood fencing; Shed(s); Corner lot; Located inside city limits; Paved road with public maintenance
Interior
- Kitchen: Dishwasher; Garbage disposal; Gas range
- Bedrooms: 2 bedrooms (one on the first floor, one on the second floor)
- Flooring: Carpet; Tile; Wood
- Bathrooms: 1 full bathroom
- Heating & cooling: Natural gas heating; Electric cooling
- Interior features: Eat-in kitchen
- Laundry & utility: Laundry located in the bathroom
Neighborhood map
What this means for you Summary
Snapshot
- This is a 2-bed/1.0-bath single-family listed at $100k.
Deal economics
- At list price, monthly cash flow is $310 ($4k/yr) — positive.
- The deal already cash-flows at list — no discount required.
- Meets the 1% rule at list price ($1k rent vs $100k).
Location & tenants
- Location reads 72/100 on livability (#125 in KS) — a middle-class / working-renter tenant base. Strengths: cost of living A+, housing A+, health & safety A+; Watch: employment D+, amenities F, commute F.
- Ottawa (town): math 23% / reading 30% proficiency, ranked #128 of 169 in KS (top 76%) — low school quality limits family demand, transient renter base, plan for 1-2y turnover.
- Zoned schools: Ottawa Sr High (math 8% / reading 17%, grade F, #278 of 327 statewide, top 86%, 727 students, 51% FRL) — zoned schools at 51% FRL track the district average.
- Zoned-school proficiency averages 12% at this address vs 26% district-wide (-14 pts) — the specific schools serving this property underperform the Ottawa average; the district grade overstates school quality for this exact location.
- Market conditions: 106 active listings in the ZIP; 1 comparable units currently listed for rent nearby; 85 units permitted in Franklin County in 2024 (0 in 5+ unit buildings).
Forward outlook
- Local home prices are declining (-3.0%/yr); year-one equity from $688 of loan paydown is wiped out by about $3k of value loss. Plan a longer hold.
- Franklin County population projected at -17% by 2050 — secular population decline; favor cash flow + early exit over multi-decade hold.
- At projected returns (-3.0% appreciation + 3.0% rent growth), your $28k cash investment doubles in ~9 years — after that, you're playing with house money.
Negotiation context
- Only 3 days on market — expect competitive offers; lowballing is unlikely to land.
- 4 sale attempts since 12y ago with the ask held roughly flat each time — persistent listings suggest the price (not the market) is what's stuck; bring a comps-based counter.
- Current owner paid $57k; list at $100k implies a 74% gain — meaningful room to come down on a strong offer.
Risks & watch-outs
- Watch-outs: built in 1930 — expect roof / HVAC / electrical / plumbing capex.
Questions for the listing agent
- Built in 1930 — when were the roof, HVAC, electrical panel, plumbing, and water heater last replaced?
- Is there a deadline driving the sale (1031 exchange, divorce, estate, relocation)? That informs how much negotiation room exists.
- Schools are F-rated, which usually means shorter tenancies and higher turnover. Who's the typical renter profile here, and what's been the actual vacancy rate?
- What's the average days-on-market for RENTAL listings here right now (not sales)? A rising rental-DOM trend means longer vacancies and softer asking-rent achievability than the comps imply.
- What's the recent tenant-quality profile in this submarket — average credit score on applications, eviction rate, late-payment / NSF rate, and stable-employment percentage? A property-management company in the area should have these aggregated.
- How much new for-sale + rental construction is in the pipeline within 1–3 miles? Heavy new supply typically softens prices + rents 12–24 months out; constrained supply supports both.
Investment metrics
- 1% rule
- 1.23% ✓
- Cap rate
- 10.03%
- Cash-on-cash
- 13.34%
- DSCR
- 1.59
- GRM
- 6.8
CMA / ARV
No comps found within radius.
Projected returns pro-forma
-3.0% appreciation · 3.0% rent growth · sell at horizon
- IRR
- 3.4%
- Equity multiple
- 1.13×
- Total profit
- $3,607
- Equity at exit
- $14,836
- IRR
- 12.9%
- Equity multiple
- 2.02×
- Total profit
- $28,547
- Equity at exit
- $8,603
Cash invested: $27,860 (down + closing). Projections, not guarantees.
Landlord ↔ Tenant lean methodology
- Overall (STATE)
- 83 Strongly Landlord-Friendly
- State Kansas
- 83 Strongly Landlord-Friendly · R+10
- County
- — inherits STATE
- City
- — inherits STATE
ZIP-level market 66067
- Home prices YoY
- -33.6%
- Active inventory
- 106
- Price-to-rent
- 6.8×
Monthly cashflow live
- Estimated rent
- $1,225 medium interval (Pro) →
- Mortgage (P&I)
- −$522
- Tax from tax record
- −$95 /mo · $1,137/yr
- Insurance
- −$41
- HOA
- −$0
- Vacancy / Maint / Mgmt
- −$257
- Net cashflow
- $310
Break-even live
UW: 25.0% down · 7.5% · 30yr · 1.5% tax · 5.0% vac · 8.0% maint · 8.0% mgmt
Financing live
Cash to close
- Down payment
- $24,875
- Closing costs
- $2,985
- Reserves months
- —
- Total cash needed
- —
Loan-product check · same deal, 3 products live
Conventional
25% down · 7.5% · 30yr
- Down + closing
- —
- Monthly P&I
- —
- Monthly cashflow
- —
- DSCR
- —
- Eligible?
- —
Personal DTI + credit; lowest rate.
DSCR
20% down · 8.5% · 30yr
- Down + closing
- —
- Monthly P&I
- —
- Monthly cashflow
- —
- DSCR
- —
- Eligible?
- —
No personal income docs; deal must DSCR.
Hard money
10% down · 12.0% · 12mo
- Down + closing
- —
- Monthly P&I
- —
- Monthly cashflow
- —
- DSCR
- —
- Eligible?
- —
Short-term bridge; refi at stabilization.
Rent comps 1 comps
| Address | Beds | Baths | Sqft | Rent | $/sqft | DOM | Units | Dist |
|---|---|---|---|---|---|---|---|---|
| 4 Canterbury Ct Ottawa, KS | 1.0–4.0 | 1.0–1.5 | 929 | $1,225 | $1.32 | 23d | 4 | 0.62mi |
Listing history 11 events
-
2026-05-04status Pending
-
2026-04-30$99,500 Active
-
2020-10-30soldstatus Closed 106-char remark
Show marketing remark (106 chars)
Quaint Rental on a large corner lot! Term Tenant. .. Rent could be increased. Currently Rents for $500/mo.
-
2020-08-08status Pending 106-char remark
Show marketing remark (106 chars)
Quaint Rental on a large corner lot! Term Tenant. .. Rent could be increased. Currently Rents for $500/mo.
-
2019-11-06$55,000
Show marketing remark (106 chars)
Quaint Rental on a large corner lot! Term Tenant. .. Rent could be increased. Currently Rents for $500/mo.
-
2019-11-06$55,000 Active 106-char remark
Show marketing remark (106 chars)
Quaint Rental on a large corner lot! Term Tenant. .. Rent could be increased. Currently Rents for $500/mo.
-
2015-01-05soldstatus
-
2014-11-21$32,500
-
2006-08-01soldstatus $57,200
-
2001-08-01soldstatus $30,876
-
1999-05-01soldstatus $12,000
ⓘ Source: listings_history table (triggers on properties + properties_extension) + one-shot
backfill from property_details.listing_events for pre-trigger history.
Tax reassessment forecast KS · Resets to sale price
- Current annual tax
- $1,137 · $95/mo
- Projected year-2 tax
- $1,403 · $117/mo
- Expected delta
- +$266/yr (+$22/mo · 23.4%)
ⓘ Screening estimate from a state-policy table — verify with the county assessor before closing.
Climate risk First Street
- Flood 1/10 Low FEMA zone X (unshaded) · 0% chance over 30 yrs
- Wildfire 2/10 Low
- Heat 4/10 Moderate 7 d/yr ≥108°F today · 17 d/yr by 30 yrs out
- Wind 2/10 Low
- Air quality 2/10 Low 1 unhealthy d/yr today · 1 by 30 yrs out
Nearby sold comps map
Loading sold comps map…
Walkable amenities ~0.75 mi
Loading nearby amenities…
Taxation est. · year 1
- Rental income
- $14,700
- − Mortgage interest
- −$5,574
- − Property taxes
- −$1,137
- − Insurance
- −$498
- − Repairs & maintenance
- −$1,176
- − Management
- −$1,176
- − Depreciation
- −$2,895
- Taxable income
- $2,246
- Est. tax owed @ 24.0%
- −$539
- After-tax cash flow
- $3,178/yr
For passive investors: Depreciation is non-cash, so a rental often shows a tax loss while cash-flowing — sheltering income. Rental losses are passive: they offset passive income freely, and up to $25,000/yr can offset ordinary (W-2) income if you actively participate and your MAGI is under $100k (phasing out to $0 by $150k); unused losses carry forward. On sale, claimed depreciation is recaptured at up to 25%, and gains may owe capital-gains tax (a 1031 exchange can defer both). Figures are a year-1 estimate at your 24.0% rate — not tax advice; consult a CPA.
Schools (NCES district)
- District
- Ottawa
- NCES district ID
- 2000015
- Math proficiency
- 23% ▲ 2.00%
- Reading proficiency
- 30% ▲ 3.00%
- Median HH income
- $46,080
- Composite
- 22.9/100
- National rank
- #8003
- State rank
- #128 of 169 in KS
Livability — Ottawa
- Score
- 72/100
- State rank
- #125
- US rank
- #6479
Category grades
Schools grade is shown separately in the Schools card above.
Census & demographics
- Census place
- Ottawa, KS
- City population
- 16,146
- Population (ZIP)
- 16,146
Population outlook (Franklin County) Hauer SSP2
- Today (2025)
- 24,777 people
- By 2030
- 24,116 · -2.7%
- By 2040
- 22,426 · -9.5%
- By 2050
- 20,555 · -17.0%
- By 2075
- 17,149 · -30.8%
- By 2100
- 14,526 · -41.4%
Race, ethnicity, and origin ACS 2023
- Neighborhood character
- Predominantly White (89%)
- Race & ethnicity
- White 89% Two or more races 6% Hispanic / Latino 4%
- Common ancestry
- Lithuanian 2% Italian 2% Slovak 1%
- Foreign-born
- 2% · Canada
- Languages at home
- 97% English-only · Spanish 2%
Political lean MEDSL · Franklin
- 2024 margin
- Solid R (+40.1) · D 28.9% · R 69.0% · Other 2.0%
- 2008→2024 swing
- -17.6pp toward R · 2008: -22.5pp · 2024: -40.1pp
- All cycles
- 2024: R+40.1 2020: R+38.4 2016: R+39.4 2012: R+30.4 2008: R+22.5
Not yet ingested
- Civics
- —
Market trends
- HPI YoY
- ▼ -156.97%
- Current HPI
- 309.5576
- Rent YoY
- —
- Metro
- —
- State GDP YoY
- —
- F500 in state
- 0
Price history
+729.2% since first listed11 events — show timeline
- 2026-05-04 Pending — Heartland MLS as Distributed by MLS Grid
- 2026-04-30 Listed $99,500 Heartland MLS as Distributed by MLS Grid
- 2020-10-30 Sold (MLS) — Heartland MLS as Distributed by MLS Grid
- 2020-08-08 Pending — Heartland MLS as Distributed by MLS Grid
- 2019-11-06 Listed $55,000 Heartland MLS as Distributed by MLS Grid
- 2019-11-06 Listed $55,000 Sunflower MLS as distributed by MLS GRID
- 2015-01-05 Sold (MLS) — Heartland MLS as Distributed by MLS Grid
- 2014-11-21 Listed $32,500 Heartland MLS as Distributed by MLS Grid
- 2006-08-01 Sold (Public Records) $57,200 Public Records
- 2001-08-01 Sold (Public Records) $30,876 Public Records
- 1999-05-01 Sold (Public Records) $12,000 Public Records
Property tax history
+1.2%/yrLatest (2025): $1,137 · +1.5% YoY. Source: county tax records.
Cash-flow waterfall
monthlySold comps — $/sqft
last 12 mo · ≤1 miLoading sold comps…