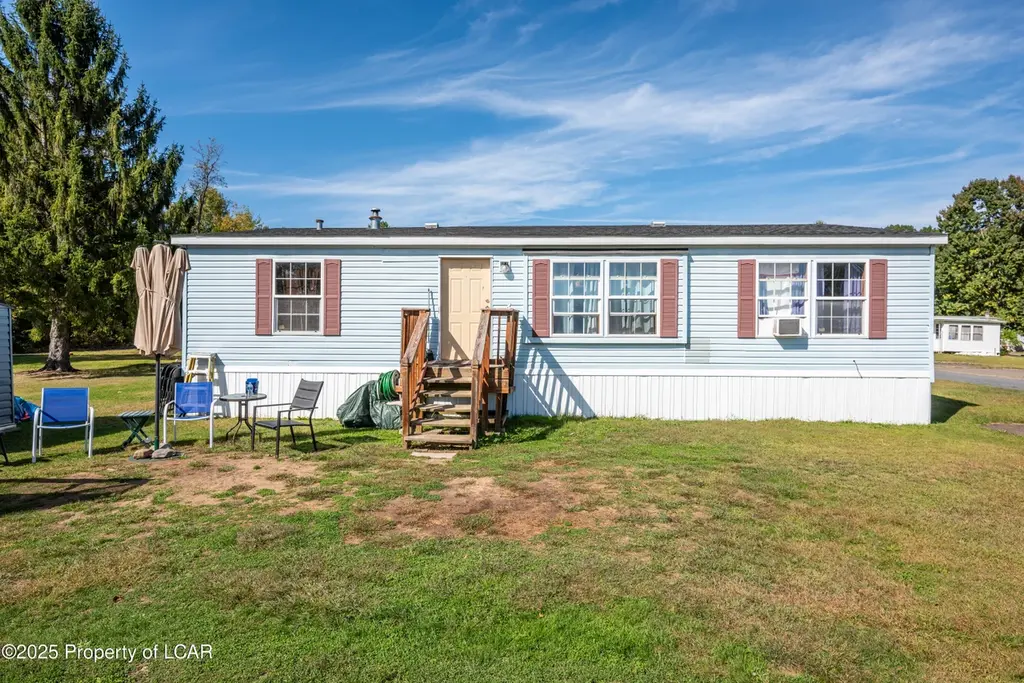
31 2nd Ln
East Berwick, PA 18603
$80,000D-
3 bd · 2.0 ba ·
1,188 sqft ·
Built 2000
· Manufactured
· Active
· 250 DOM
Cashflow @ list (25.0% down · 7.5%)
Estimated rent
$1,156/mo
Mortgage (P&I)
−$420
Tax + insurance
−$104
HOA
−$550
Vac / Maint / Mgmt
−$243
Net cashflow
$-161/mo
Annual
$-1,931/yr
Cap rate
3.88%
Cash-on-cash
-8.62%
DSCR
0.62
1% rule
1.44%
Cash to close
$22,400
Investor read
- This is a 3-bed/2.0-bath manufactured listed at $80k.
- At list price, monthly cash flow is $-161 ($-2k/yr) — negative.
- To cash-flow at today's rent, offer at most $52k (35.5% below list).
- Meets the 1% rule at list price ($1k rent vs $80k).
- It's been on market 250 days — a 12% lower offer ($70k) is reasonable based on typical stale-listing flexibility.
- Recommended offer: $52k (35.5% below list) — sets the bar for cash-flow.
- Local home prices are declining (-3.0%/yr); year-one equity from $553 of loan paydown is wiped out by about $2k of value loss. Plan a longer hold.
- Location reads 76/100 on livability (#416 in PA, #3,789 nationally) — a middle-class / working-renter tenant base. Strengths: crime A+, employment A+, cost of living A+; Watch: amenities F, commute F.
- Berwick Area SD (other): math 32% / reading 57% proficiency, ranked #291 of 539 in PA (top 54%) — families likely to look elsewhere, expect single-tenant / working-renter base with shorter leases.
- Zoned schools: Salem El Sch (math 57% / reading 67%, grade B, #313 of 1,518 statewide, top 24%, 396 students, 100% FRL); Berwick Area Ms (math 19% / reading 54%, grade F, #307 of 512 statewide, top 61%, 844 students, 100% FRL); Berwick Area Hs (math 57% / reading 70%, grade B-, #69 of 437 statewide, top 16%, 782 students, 100% FRL) — zoned schools average 100% FRL vs 46% district-wide (54 pts higher); higher-poverty schools than district average — tighter screening recommended.
- Watch-outs: HOA is 48% of rent.
- Market conditions: 91 active listings in the ZIP; 349 units permitted in Luzerne County in 2024 (16 in 5+ unit buildings).
- Luzerne County population projected at +4% by 2050 — modest demand growth; plan on rents tracking national, not racing it.
- 3 sale attempts since 2y ago with the ask held roughly flat each time — persistent listings suggest the price (not the market) is what's stuck; bring a comps-based counter.
- Current owner paid $60k; 33% above their basis — modest negotiation headroom, anchor on the comps not their cost.
Questions for listing agent
- What do current leases actually rent for vs. the listed asking? Can we see a recent rent roll and the last 12 months of T-12 income?
- It's been on market 250 days. Have you received any prior offers? Is the seller open to a 36% concession, seller financing, or rate buy-down credit?
- What does the HOA fee cover, when was the last increase, and are there any pending special assessments or reserve-fund shortfalls?
- Why hasn't it sold? Are there any deal-killer items the seller is aware of (foundation, flood, title, zoning, code violations)?
- Is there a deadline driving the sale (1031 exchange, divorce, estate, relocation)? That informs how much negotiation room exists.
- The area grade is low — what's the realistic commute time and amenity access for the typical tenant pool here? Any planned neighborhood developments (good or bad) we should know about?
- What's the average days-on-market for RENTAL listings here right now (not sales)? A rising rental-DOM trend means longer vacancies and softer asking-rent achievability than the comps imply.
- What's the recent tenant-quality profile in this submarket — average credit score on applications, eviction rate, late-payment / NSF rate, and stable-employment percentage? A property-management company in the area should have these aggregated.
CashFlowRE · CFR-W3GY30DJNM0QNY
· Data 2 h ago
cashflowre.app · 2026-05-29