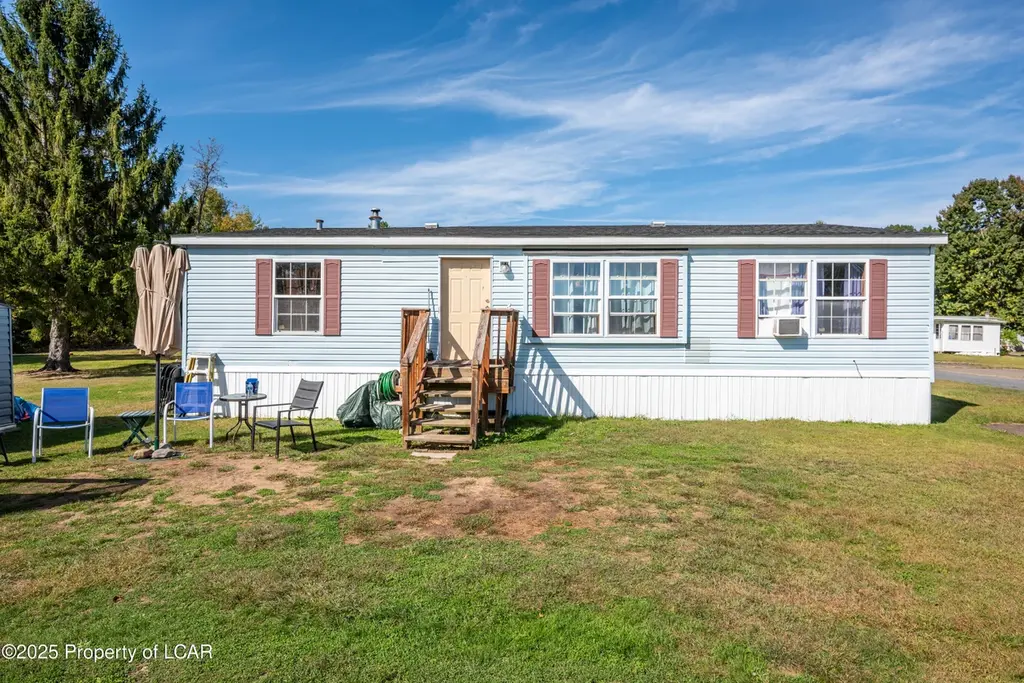
31 2nd Ln · East Berwick, PA
Flood risk 1/10 · Minimal
- FEMA flood zone
- X (unshaded)
- Chance of flooding over 30 yrs
- 0.0%
- Est. flood insurance / yr
- $507 – $1,088
Fire risk 3/10 · Minor
- Est. fire insurance / yr
- $511 – $949
Heat risk 3/10 · Minor
- Hot days now (above 99°F)
- 7 days/yr
- Hot days in 30 yrs
- 15 days/yr
Wind risk 3/10 · Minor
- Chance of severe wind over 30 yrs
- 4.0%
Air-quality risk 2/10 · Minimal
- Unhealthy air days now
- 1 days/yr
- Unhealthy air days in 30 yrs
- 2 days/yr
Risk factors via First Street. Map © Google.
Why this score? — see what drove the D- grade
The composite is a weighted blend of 9 inputs, each scored 0–100. Each bar is that input's sub-score; the figure is the points it added to the 100-point composite (weight × sub-score).
- 1% rule +9.4/10.0
- ARV discount +7.5/15.0
- Cash flow +5.8/30.0
- Livability +3.8/5.0
- Schools +3.7/10.0
- Rent growth +2.5/5.0
- Condition / age +2.5/5.0
- DSCR +0.2/10.0
- Appreciation +0.0/10.0
$80,000
🖨 Deal sheet (PDF) 📄 Offer letter ✓ Due diligence
Listing remarks MLS
Come this this beautiful mobile home built in 2000!!! this 3-bedroom, 2 bath home has a tastefully updated interior, including a huge primary bathroom! located in the quaint town of Berwick, you won't be disappointed with this affordable and stylish living!
Key facts
- Built 2000
- Listed 250 days
Neighborhood map
What this means for you Summary
Snapshot
- This is a 3-bed/2.0-bath manufactured listed at $80k.
Deal economics
- At list price, monthly cash flow is $-161 ($-2k/yr) — negative.
- To cash-flow at today's rent, offer at most $52k (35.5% below list).
- Meets the 1% rule at list price ($1k rent vs $80k).
- Recommended offer: $52k (35.5% below list) — sets the bar for cash-flow.
Location & tenants
- Location reads 76/100 on livability (#416 in PA, #3,789 nationally) — a middle-class / working-renter tenant base. Strengths: crime A+, employment A+, cost of living A+; Watch: amenities F, commute F.
- Berwick Area SD (other): math 32% / reading 57% proficiency, ranked #291 of 539 in PA (top 54%) — families likely to look elsewhere, expect single-tenant / working-renter base with shorter leases.
- Zoned schools: Salem El Sch (math 57% / reading 67%, grade B, #313 of 1,518 statewide, top 24%, 396 students, 100% FRL); Berwick Area Ms (math 19% / reading 54%, grade F, #307 of 512 statewide, top 61%, 844 students, 100% FRL); Berwick Area Hs (math 57% / reading 70%, grade B-, #69 of 437 statewide, top 16%, 782 students, 100% FRL) — zoned schools average 100% FRL vs 46% district-wide (54 pts higher); higher-poverty schools than district average — tighter screening recommended.
- Market conditions: 91 active listings in the ZIP; 349 units permitted in Luzerne County in 2024 (16 in 5+ unit buildings).
Forward outlook
- Local home prices are declining (-3.0%/yr); year-one equity from $553 of loan paydown is wiped out by about $2k of value loss. Plan a longer hold.
- Luzerne County population projected at +4% by 2050 — modest demand growth; plan on rents tracking national, not racing it.
Negotiation context
- It's been on market 250 days — a 12% lower offer ($70k) is reasonable based on typical stale-listing flexibility.
- 3 sale attempts since 2y ago with the ask held roughly flat each time — persistent listings suggest the price (not the market) is what's stuck; bring a comps-based counter.
- Current owner paid $60k; 33% above their basis — modest negotiation headroom, anchor on the comps not their cost.
Risks & watch-outs
- Watch-outs: HOA is 48% of rent.
Questions for the listing agent
- What do current leases actually rent for vs. the listed asking? Can we see a recent rent roll and the last 12 months of T-12 income?
- It's been on market 250 days. Have you received any prior offers? Is the seller open to a 36% concession, seller financing, or rate buy-down credit?
- What does the HOA fee cover, when was the last increase, and are there any pending special assessments or reserve-fund shortfalls?
- Why hasn't it sold? Are there any deal-killer items the seller is aware of (foundation, flood, title, zoning, code violations)?
- Is there a deadline driving the sale (1031 exchange, divorce, estate, relocation)? That informs how much negotiation room exists.
- The area grade is low — what's the realistic commute time and amenity access for the typical tenant pool here? Any planned neighborhood developments (good or bad) we should know about?
- What's the average days-on-market for RENTAL listings here right now (not sales)? A rising rental-DOM trend means longer vacancies and softer asking-rent achievability than the comps imply.
- What's the recent tenant-quality profile in this submarket — average credit score on applications, eviction rate, late-payment / NSF rate, and stable-employment percentage? A property-management company in the area should have these aggregated.
- How much new for-sale + rental construction is in the pipeline within 1–3 miles? Heavy new supply typically softens prices + rents 12–24 months out; constrained supply supports both.
Investment metrics
- 1% rule
- 1.44% ✓
- Cap rate
- 3.88%
- Cash-on-cash
- -8.62%
- DSCR
- 0.62
- GRM
- 5.8
CMA / ARV
No comps found within radius.
Projected returns pro-forma
-3.0% appreciation · 3.0% rent growth · sell at horizon
- IRR
- -30.8%
- Equity multiple
- -0.02×
- Total profit
- $-22,873
- Equity at exit
- $11,928
- IRR
- -30.6%
- Equity multiple
- -0.42×
- Total profit
- $-31,739
- Equity at exit
- $6,917
Cash invested: $22,400 (down + closing). Projections, not guarantees.
Landlord ↔ Tenant lean methodology
- Overall (STATE)
- 62 Landlord-Friendly
- State Pennsylvania
- 62 Landlord-Friendly · EVEN
- County
- — inherits STATE
- City
- — inherits STATE
ZIP-level market 18603
- Active inventory
- 91
- Price-to-rent
- 5.8×
Monthly cashflow live
- Estimated rent
- $1,156 medium interval (Pro) →
- Mortgage (P&I)
- −$420
- Tax from tax record
- −$71 /mo · $854/yr
- Insurance
- −$33
- HOA
- −$550
- Lot rent leased land?
- −$0
- Vacancy / Maint / Mgmt
- −$243
- Net cashflow
- $-161
Break-even live
Sensitivity live
| Price | -10% $-116 | -5% $-138 | +0% $-161 | +5% $-184 | +10% $-206 |
|---|---|---|---|---|---|
| Rent | -10% $-252 | -5% $-207 | +0% $-161 | +5% $-115 | +10% $-70 |
| Rate | -1.0pp $-121 | -0.5pp $-141 | base $-161 | +0.5pp $-182 | +1.0pp $-203 |
UW: 25.0% down · 7.5% · 30yr · 1.5% tax · 5.0% vac · 8.0% maint · 8.0% mgmt
Financing live
Cash to close
- Down payment
- $20,000
- Closing costs
- $2,400
- Reserves months
- —
- Total cash needed
- —
Loan-product check · same deal, 3 products live
Conventional
25% down · 7.5% · 30yr
- Down + closing
- —
- Monthly P&I
- —
- Monthly cashflow
- —
- DSCR
- —
- Eligible?
- —
Personal DTI + credit; lowest rate.
DSCR
20% down · 8.5% · 30yr
- Down + closing
- —
- Monthly P&I
- —
- Monthly cashflow
- —
- DSCR
- —
- Eligible?
- —
No personal income docs; deal must DSCR.
Hard money
10% down · 12.0% · 12mo
- Down + closing
- —
- Monthly P&I
- —
- Monthly cashflow
- —
- DSCR
- —
- Eligible?
- —
Short-term bridge; refi at stabilization.
HOA detail
- Monthly dues
- $550 · $6,600/yr
Listing history 20 events
-
2026-06-22days on market $80,000 Active 250 DOM
-
2026-06-19days on market $80,000 Active 247 DOM
-
2026-06-18days on market $80,000 Active 246 DOM
-
2026-06-17days on market $80,000 Active 245 DOM
-
2026-06-16days on market $80,000 Active 244 DOM
-
2026-06-15days on market $80,000 Active 243 DOM
-
2026-06-14days on market $80,000 Active 241 DOM
-
2026-06-12days on market $80,000 Active 240 DOM
-
2026-06-09days on market $80,000 Active 237 DOM
-
2026-06-08days on market $80,000 Active 236 DOM
-
2026-06-07days on market $80,000 Active 235 DOM
-
2026-06-03days on market $80,000 Active 230 DOM
-
2026-05-31days on market $80,000 Active 229 DOM
-
2026-05-30days on market $80,000 Active 228 DOM
-
2026-02-08status Active 258-char remark
Show marketing remark (258 chars)
Come this this beautiful mobile home built in 2000!!! this 3-bedroom, 2 bath home has a tastefully updated interior, including a huge primary bathroom! located in the quaint town of Berwick, you won't be disappointed with this affordable and stylish living!
-
2026-02-01historical 258-char remark
Show marketing remark (258 chars)
Come this this beautiful mobile home built in 2000!!! this 3-bedroom, 2 bath home has a tastefully updated interior, including a huge primary bathroom! located in the quaint town of Berwick, you won't be disappointed with this affordable and stylish living!
-
2025-10-07$80,000 Active 258-char remark
Show marketing remark (258 chars)
Come this this beautiful mobile home built in 2000!!! this 3-bedroom, 2 bath home has a tastefully updated interior, including a huge primary bathroom! located in the quaint town of Berwick, you won't be disappointed with this affordable and stylish living!
-
2024-06-20soldstatus $60,000 Closed 361-char remark
Show marketing remark (361 chars)
Home features 3 bedrooms and 2 baths. The primary bedroom has an en-suite and walk-in closet. Modern kitchen. Located in Pleasant View mobile home community. Lot Rent is $465 per month water, sewer, trash included OWNER FINANCING TO QUALIFIED BUYER WITH 25% MIN CASH DOWN PAYMENT, CREDIT SCORE MIN 650,AND 3 TIMES MONTHLY TOTAL PAYMENT AMOUNT VERIFIABLE INCOME!
-
2024-04-15price $67,400 361-char remark
Show marketing remark (361 chars)
Home features 3 bedrooms and 2 baths. The primary bedroom has an en-suite and walk-in closet. Modern kitchen. Located in Pleasant View mobile home community. Lot Rent is $465 per month water, sewer, trash included OWNER FINANCING TO QUALIFIED BUYER WITH 25% MIN CASH DOWN PAYMENT, CREDIT SCORE MIN 650,AND 3 TIMES MONTHLY TOTAL PAYMENT AMOUNT VERIFIABLE INCOME!
-
2024-02-16$69,900 Active 361-char remark
Show marketing remark (361 chars)
Home features 3 bedrooms and 2 baths. The primary bedroom has an en-suite and walk-in closet. Modern kitchen. Located in Pleasant View mobile home community. Lot Rent is $465 per month water, sewer, trash included OWNER FINANCING TO QUALIFIED BUYER WITH 25% MIN CASH DOWN PAYMENT, CREDIT SCORE MIN 650,AND 3 TIMES MONTHLY TOTAL PAYMENT AMOUNT VERIFIABLE INCOME!
ⓘ Source: listings_history table (triggers on properties + properties_extension) + one-shot
backfill from property_details.listing_events for pre-trigger history.
Tax reassessment forecast PA · Partial reset (capped growth)
- Current annual tax
- $854 · $71/mo
- Projected year-2 tax
- $1,059 · $88/mo
- Expected delta
- +$205/yr (+$17/mo · 24.0%)
ⓘ Screening estimate from a state-policy table — verify with the county assessor before closing.
Climate risk First Street
- Flood 1/10 Low FEMA zone X (unshaded) · 0% chance over 30 yrs
- Wildfire 3/10 Moderate
- Heat 3/10 Moderate 7 d/yr ≥99°F today · 15 d/yr by 30 yrs out
- Wind 3/10 Moderate 4% chance of damaging wind over 30 yrs
- Air quality 2/10 Low 1 unhealthy d/yr today · 2 by 30 yrs out
Nearby sold comps map
Loading sold comps map…
Walkable amenities ~0.75 mi
Loading nearby amenities…
Taxation est. · year 1
- Rental income
- $13,870
- − Mortgage interest
- −$4,481
- − Property taxes
- −$854
- − Insurance
- −$400
- − Repairs & maintenance
- −$1,110
- − Management
- −$1,110
- − HOA
- −$6,600
- − Depreciation
- −$2,327
- Taxable loss
- −$3,011
- Est. tax savings @ 24.0%
- +$723
- After-tax cash flow
- $-1,208/yr
For passive investors: Depreciation is non-cash, so a rental often shows a tax loss while cash-flowing — sheltering income. Rental losses are passive: they offset passive income freely, and up to $25,000/yr can offset ordinary (W-2) income if you actively participate and your MAGI is under $100k (phasing out to $0 by $150k); unused losses carry forward. On sale, claimed depreciation is recaptured at up to 25%, and gains may owe capital-gains tax (a 1031 exchange can defer both). Figures are a year-1 estimate at your 24.0% rate — not tax advice; consult a CPA.
Schools (NCES district)
- District
- Berwick Area SD
- NCES district ID
- 4203480
- Math proficiency
- 32% ▼ -14.00%
- Reading proficiency
- 57% ▼ -6.00%
- Median HH income
- $41,964
- Composite
- 37.36/100
- National rank
- #4433
- State rank
- #291 of 539 in PA
Livability — East Berwick
- Score
- 76/100
- State rank
- #416
- US rank
- #3789
Category grades
Schools grade is shown separately in the Schools card above.
Census & demographics
- Population (ZIP)
- 18,985
Population outlook (Luzerne County) Hauer SSP2
- Today (2025)
- 319,505 people
- By 2030
- 319,943 · +0.1%
- By 2040
- 322,643 · +1.0%
- By 2050
- 330,817 · +3.5%
- By 2075
- 379,145 · +18.7%
- By 2100
- 431,908 · +35.2%
Race, ethnicity, and origin ACS 2023
- Neighborhood character
- Predominantly White (91%)
- Race & ethnicity
- White 91% Hispanic / Latino 4% Two or more races 3% Black 3%
- Common ancestry
- Romanian 6% Polish 4% Iranian 3%
- Foreign-born
- 3% · Canada
- Languages at home
- 97% English-only · Spanish 2% Russian/Polish/Slavic 1%
Political lean MEDSL · Luzerne
- 2024 margin
- R (+19.2) · D 40.0% · R 59.2%
- 2008→2024 swing
- -27.6pp toward R · 2008: 8.4pp · 2024: -19.2pp
- All cycles
- 2024: R+19.2 2020: R+14.4 2016: R+19.6 2012: D+4.8 2008: D+8.4
Not yet ingested
- Civics
- —
Market trends
- HPI YoY
- ▼ -123.40%
- Current HPI
- 211.5643
- Rent YoY
- —
- Metro
- —
- State GDP YoY
- ▲ 1.68%
- F500 in state
- 34
Industry mix (Fortune 500 HQ in PA)
| Industry | F500 HQs | Revenue |
|---|---|---|
| Healthcare | 2 | $309B |
|
||
| Insurance | 2 | $27B |
|
||
| Telecommunications / Media | 1 | $124B |
|
||
| Industrial Distribution | 1 | $22B |
|
||
| Financial Services | 1 | $20B |
|
||
| Chemicals / Materials | 1 | $18B |
|
||
Price history
+14.4% since first listed6 events — show timeline
- 2026-02-08 Relisted — LCAR
- 2026-02-01 Delisted — LCAR
- 2025-10-07 Listed $80,000 LCAR
- 2024-06-20 Sold (MLS) $60,000 LCAR
- 2024-04-15 Price Changed $67,400 LCAR
- 2024-02-16 Listed $69,900 LCAR
Property tax history
+2.1%/yrLatest (2026): $854 · +1.4% YoY. Source: county tax records.
Cash-flow waterfall
monthlySold comps — $/sqft
last 12 mo · ≤1 miLoading sold comps…