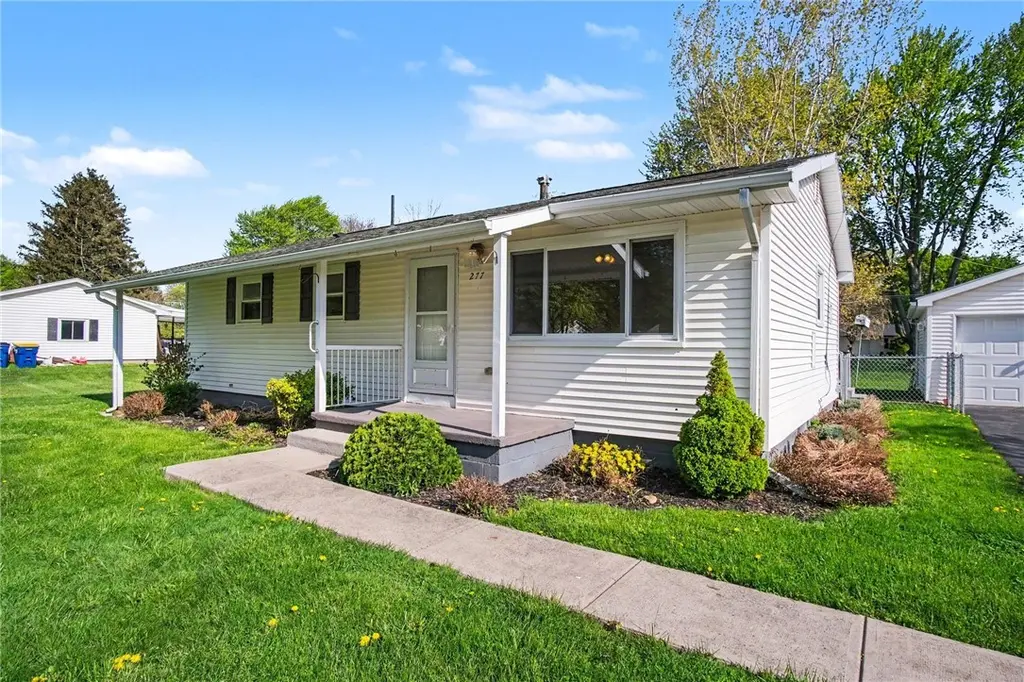
277 Lycoming Rd
Brighton, NY 14623
$225,000C-
3 bd · 1.0 ba ·
992 sqft ·
Built 1956
· SingleFamily
· Pending
· 9 DOM
Cashflow @ list (25.0% down · 7.5%)
Estimated rent
$2,153/mo
Mortgage (P&I)
−$1,180
Tax + insurance
−$539
HOA
−$0
Vac / Maint / Mgmt
−$452
Net cashflow
$-18/mo
Annual
$-219/yr
Cap rate
6.20%
Cash-on-cash
-0.35%
DSCR
0.98
1% rule
0.96%
Cash to close
$63,000
Investor read
- This is a 3-bed/1.0-bath single-family listed at $225k.
- At list price, monthly cash flow is $-18 ($-219/yr) — negative.
- To cash-flow at today's rent, offer at most $222k (1.4% below list).
- To meet the 1% rule (rent ≥ 1% of price), the offer needs to be $215k (4.3% below list).
- Only 9 days on market — expect competitive offers; lowballing is unlikely to land.
- Recommended offer: $215k (4.3% below list) — sets the bar for 1% rule.
- Local home prices are declining (-3.0%/yr); year-one equity from $2k of loan paydown is wiped out by about $7k of value loss. Plan a longer hold.
- Location reads 81/100 on livability (#89 in NY, #1,379 nationally) — a professional / high-income tenant draw. Strengths: housing A+, health & safety A+, schools B+; Watch: crime D+, amenities D-.
- Rush-Henrietta Central School District (suburban): math 62% / reading 57% proficiency, ranked #237 of 590 in NY (top 40%) — acceptable for families but not a draw, mixed tenant base, ~2y average lease.
- Watch-outs: built in 1956 — expect roof / HVAC / electrical / plumbing capex.
- Market conditions: Rents rising fast (+6.1%/yr); 48 active listings in the ZIP; 2 comparable units currently listed for rent nearby; 1,169 units permitted in Monroe County in 2024 (591 in 5+ unit buildings).
- Monroe County population projected to shrink 6% by 2050 — rents likely to lag national; underwrite the cash flow, not the appreciation.
- 2 sale attempts since 12y ago with the ask held roughly flat each time — persistent listings suggest the price (not the market) is what's stuck; bring a comps-based counter.
- Current owner paid $85k; list at $225k implies a 165% gain — meaningful room to come down on a strong offer.
- Cap rate 6.2% vs local median 3.9% in Brighton — top-decile yield for the area; either an underpriced asset or a hidden risk that comps aren't pricing in. Stress-test before assuming the spread holds.
- This rent runs 40% of the median local income ($65k/yr) — at the standard rent-burdened threshold; future hikes will face affordability resistance.
Questions for listing agent
- What do current leases actually rent for vs. the listed asking? Can we see a recent rent roll and the last 12 months of T-12 income?
- Built in 1956 — when were the roof, HVAC, electrical panel, plumbing, and water heater last replaced?
- Is there a deadline driving the sale (1031 exchange, divorce, estate, relocation)? That informs how much negotiation room exists.
- Schools are B-rated — typically a magnet for longer-tenancy family renters. What's the average tenant stay here, and is there a school-zone premium baked into asking?
- Crime grade is D in this area — have there been break-ins, vandalism, or insurance claims at this property in the last 3 years? What carrier currently insures it and at what premium?
- What's the average days-on-market for RENTAL listings here right now (not sales)? A rising rental-DOM trend means longer vacancies and softer asking-rent achievability than the comps imply.
- What's the recent tenant-quality profile in this submarket — average credit score on applications, eviction rate, late-payment / NSF rate, and stable-employment percentage? A property-management company in the area should have these aggregated.
- How much new for-sale + rental construction is in the pipeline within 1–3 miles? Heavy new supply typically softens prices + rents 12–24 months out; constrained supply supports both.
CashFlowRE · CFR-W3YSX7ACDF2M88
· Data 3 weeks ago
cashflowre.app · 2026-05-29