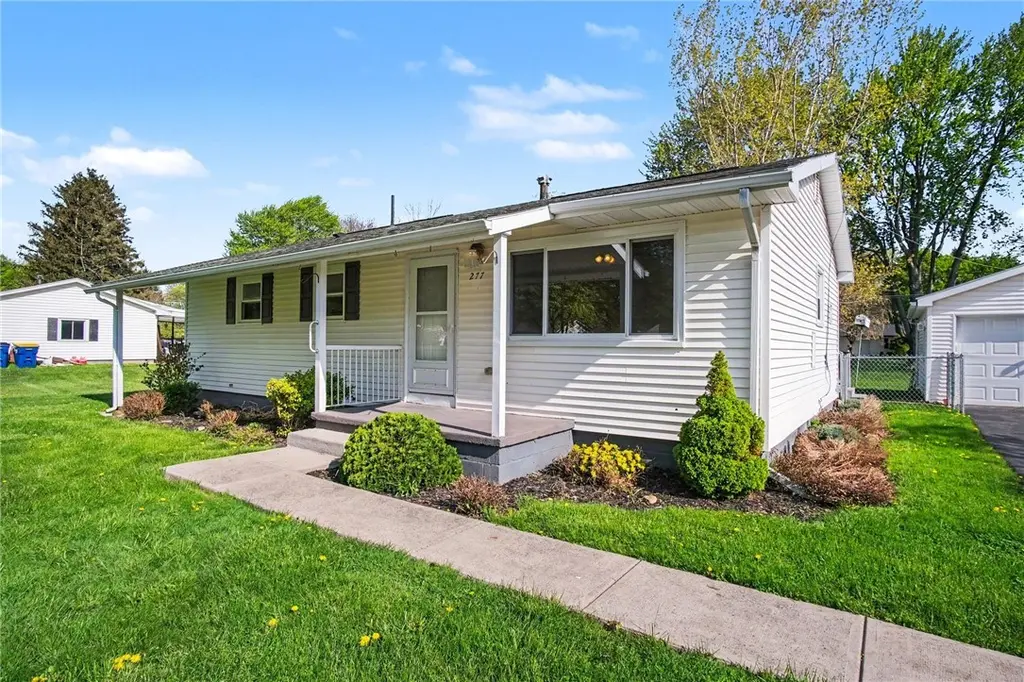
277 Lycoming Rd · Brighton, NY
Flood risk 1/10 · Minimal
- FEMA flood zone
- X (unshaded)
- Chance of flooding over 30 yrs
- 0.0%
- Est. flood insurance / yr
- $473 – $860
Fire risk 1/10 · Minimal
- Est. fire insurance / yr
- $691 – $1,283
Heat risk 2/10 · Minimal
- Hot days now (above 95°F)
- 7 days/yr
- Hot days in 30 yrs
- 15 days/yr
Wind risk 1/10 · Minimal
- Chance of severe wind over 30 yrs
- —
Air-quality risk 2/10 · Minimal
- Unhealthy air days now
- 1 days/yr
- Unhealthy air days in 30 yrs
- 1 days/yr
Risk factors via First Street. Map © Google.
Why this score? — see what drove the C- grade
The composite is a weighted blend of 9 inputs, each scored 0–100. Each bar is that input's sub-score; the figure is the points it added to the 100-point composite (weight × sub-score).
- ARV discount +14.4/15.0
- Cash flow +12.9/30.0
- Schools +5.2/10.0
- 1% rule +4.6/10.0
- Rent growth +4.0/5.0
- Livability +4.0/5.0
- DSCR +3.8/10.0
- Condition / age +2.5/5.0
- Appreciation +0.0/10.0
$225,000
🖨 Deal sheet 📄 Offer letter ✓ Due diligence
Listing remarks MLS
This cozy 3 bedroom ranch is waiting for some tender loving care. Family home, now awaits a new family. Deck, yard, detached 2 car garage on quiet neighborhood street. Immediate possession. Roof, furnace, A/C all 10 years old.
Key facts
- 0.47 acre lot
- 2 garage spots
- Built 1956
Property features AI
Exterior
- Parking: Detached garage with electricity and garage door opener; Driveway parking
- Utilities: Electricity connected (circuit breakers); Public water connected; Sewer connected; High-speed internet available; Cable available
- Home design: Ranch-style single-story home; One story; Entry level main floor
- Construction: Asphalt roof; Vinyl siding; Copper plumbing; Block foundation; Existing construction
- Exterior features: Blacktop driveway; Deck; Covered porch; Private yard; Fence (partial); See remarks
Interior
- Kitchen: Dishwasher; Free-standing range; Microwave; Oven; Refrigerator; Eat-in kitchen
- Bedrooms: Three main-level bedrooms
- Flooring: Carpet; Hardwood; Varies
- Bathrooms: One full bathroom (main level)
- Heating & cooling: Gas forced-air heating; Central air conditioning
- Interior features: Ceiling fans; Eat-in kitchen; Separate/formal living room; Convertible bedroom; Main-level primary bedroom; Programmable thermostat; Thermal windows; Accessible bedroom; No stairs
- Laundry & utility: Laundry in basement; Gas water heater
Neighborhood map
What this means for you Summary
Snapshot
- This is a 3-bed/1.0-bath single-family listed at $225k.
Deal economics
- At list price, monthly cash flow is $-18 ($-219/yr) — negative.
- To cash-flow at today's rent, offer at most $222k (1.4% below list).
- To meet the 1% rule (rent ≥ 1% of price), the offer needs to be $215k (4.3% below list).
- Recommended offer: $215k (4.3% below list) — sets the bar for 1% rule.
- Cap rate 6.2% vs local median 3.9% in Brighton — top-decile yield for the area; either an underpriced asset or a hidden risk that comps aren't pricing in. Stress-test before assuming the spread holds.
Location & tenants
- Location reads 81/100 on livability (#89 in NY, #1,379 nationally) — a professional / high-income tenant draw. Strengths: housing A+, health & safety A+, schools B+; Watch: crime D+, amenities D-.
- Rush-Henrietta Central School District (suburban): math 62% / reading 57% proficiency, ranked #237 of 590 in NY (top 40%) — acceptable for families but not a draw, mixed tenant base, ~2y average lease.
- Market conditions: Rents rising fast (+6.1%/yr); 48 active listings in the ZIP; 2 comparable units currently listed for rent nearby; 1,169 units permitted in Monroe County in 2024 (591 in 5+ unit buildings).
- This rent runs 40% of the median local income ($65k/yr) — at the standard rent-burdened threshold; future hikes will face affordability resistance.
Forward outlook
- Local home prices are declining (-3.0%/yr); year-one equity from $2k of loan paydown is wiped out by about $7k of value loss. Plan a longer hold.
- Monroe County population projected to shrink 6% by 2050 — rents likely to lag national; underwrite the cash flow, not the appreciation.
Negotiation context
- Only 9 days on market — expect competitive offers; lowballing is unlikely to land.
- 2 sale attempts since 12y ago with the ask held roughly flat each time — persistent listings suggest the price (not the market) is what's stuck; bring a comps-based counter.
- Current owner paid $85k; list at $225k implies a 165% gain — meaningful room to come down on a strong offer.
Risks & watch-outs
- Watch-outs: built in 1956 — expect roof / HVAC / electrical / plumbing capex.
Questions for the listing agent
- What do current leases actually rent for vs. the listed asking? Can we see a recent rent roll and the last 12 months of T-12 income?
- Built in 1956 — when were the roof, HVAC, electrical panel, plumbing, and water heater last replaced?
- Is there a deadline driving the sale (1031 exchange, divorce, estate, relocation)? That informs how much negotiation room exists.
- Schools are B-rated — typically a magnet for longer-tenancy family renters. What's the average tenant stay here, and is there a school-zone premium baked into asking?
- Crime grade is D in this area — have there been break-ins, vandalism, or insurance claims at this property in the last 3 years? What carrier currently insures it and at what premium?
- What's the average days-on-market for RENTAL listings here right now (not sales)? A rising rental-DOM trend means longer vacancies and softer asking-rent achievability than the comps imply.
- What's the recent tenant-quality profile in this submarket — average credit score on applications, eviction rate, late-payment / NSF rate, and stable-employment percentage? A property-management company in the area should have these aggregated.
- How much new for-sale + rental construction is in the pipeline within 1–3 miles? Heavy new supply typically softens prices + rents 12–24 months out; constrained supply supports both.
Investment metrics
- 1% rule
- 0.96% ✗
- Cap rate
- 6.20%
- Cash-on-cash
- -0.35%
- DSCR
- 0.98
- GRM
- 8.7
CMA / ARV
- ARV (median comp)
- $265,893
- List price
- $225,000
- Delta
- -15.38%
- Verdict
- UNDERPRICED
- Comps
- 20 within 1.0 mi
Show comp detail 12 sales within ~0.75 mi
| Address | Dist | Beds/Ba | Sqft | Sold | Price | $/sf | Match |
|---|---|---|---|---|---|---|---|
| 16 Burt Dr | 0.06mi | 3/1.0 | 1,000 (+1%) | 7mo | $176,000 | $176 | 90 |
| 85 Lalanne Rd | 0.06mi | 2/1.5 (-1) | 992 (0%) | 8mo | $260,000 | $262 | 83 |
| 48 Coronet Rd | 0.43mi | 3/1.0 | 1,008 (+2%) | 3mo | $270,000 | $268 | 75 |
| 16 Down St | 0.44mi | 3/1.0 | 1,000 (+1%) | 6mo | $210,000 | $210 | 73 |
| 172 Hollybrook Rd | 0.22mi | 3/1.0 | 1,069 (+8%) | 9mo | $235,000 | $220 | 69 |
| 384 Hollybrook Rd | 0.67mi | 3/1.5 | 1,000 (+1%) | 2mo | $285,000 | $285 | 64 |
| 292 Hollybrook Rd | 0.47mi | 2/1.5 (-1) | 1,025 (+3%) | 3mo | $261,000 | $255 | 64 |
| 199 Castle Rd | 0.60mi | 3/1.0 | 1,050 (+6%) | 1mo | $226,000 | $215 | 61 |
| 39 Castle Rd | 0.60mi | 3/1.0 | 1,025 (+3%) | 7mo | $245,000 | $239 | 61 |
| 88 Rouge Rd | 0.73mi | 3/1.0 | 1,012 (+2%) | 7mo | $245,900 | $243 | 57 |
| 87 Colony Ln | 0.57mi | 3/1.0 | 1,120 (+13%) | 7mo | $235,000 | $210 | 46 |
| 1108 Farnsworth Rd S | 0.63mi | 3/1.0 | 1,108 (+12%) | 6mo | $220,000 | $199 | 46 |
Match score weights: distance 35% · size 25% · config 20% · recency 20%. Top-matched comps best support the ARV.
Projected returns pro-forma
-3.0% appreciation · 6.06% rent growth · sell at horizon
- IRR
- -13.1%
- Equity multiple
- 0.51×
- Total profit
- $-30,656
- Equity at exit
- $33,548
- IRR
- 0.4%
- Equity multiple
- 1.03×
- Total profit
- $2,201
- Equity at exit
- $19,454
Cash invested: $63,000 (down + closing). Projections, not guarantees.
Landlord ↔ Tenant lean methodology
- Overall (STATE)
- 15 Strongly Tenant-Friendly
- State New York
- 15 Strongly Tenant-Friendly · D+10
- County
- — inherits STATE
- City
- — inherits STATE
ZIP-level market 14623
- Rents YoY
- 6.1%
- Active inventory
- 48
- Price-to-rent
- 8.7×
Monthly cashflow live
- Estimated rent
- $2,153 medium interval (Pro) →
- Mortgage (P&I)
- −$1,180
- Tax from tax record
- −$445 /mo · $5,342/yr
- Insurance
- −$94
- HOA
- −$0
- Vacancy / Maint / Mgmt
- −$452
- Net cashflow
- $-18
Break-even live
UW: 25.0% down · 7.5% · 30yr · 1.5% tax · 5.0% vac · 8.0% maint · 8.0% mgmt
Financing live
Cash to close
- Down payment
- $56,250
- Closing costs
- $6,750
- Reserves months
- —
- Total cash needed
- —
Loan-product check · same deal, 3 products live
Conventional
25% down · 7.5% · 30yr
- Down + closing
- —
- Monthly P&I
- —
- Monthly cashflow
- —
- DSCR
- —
- Eligible?
- —
Personal DTI + credit; lowest rate.
DSCR
20% down · 8.5% · 30yr
- Down + closing
- —
- Monthly P&I
- —
- Monthly cashflow
- —
- DSCR
- —
- Eligible?
- —
No personal income docs; deal must DSCR.
Hard money
10% down · 12.0% · 12mo
- Down + closing
- —
- Monthly P&I
- —
- Monthly cashflow
- —
- DSCR
- —
- Eligible?
- —
Short-term bridge; refi at stabilization.
Rent comps 2 comps
| Address | Beds | Baths | Sqft | Rent | $/sqft | DOM | Units | Dist |
|---|---|---|---|---|---|---|---|---|
| 2001-2055 E Henrietta Rd Rochester, NY | 2.0 | 1.0 | 650 | $1,525 | $2.35 | 2d | 8 | 0.50mi |
| 2655 Brighton Henrietta Town Line Rd Rochester, NY | 1.0–2.0 | 1.0 | 769 | $1,870 | $2.43 | 2d | 6 | 1.39mi |
Listing history 5 events
-
2026-05-15status Pending 552-char remark
-
2026-05-06$225,000 Active 552-char remark
-
2014-12-12soldstatus $85,000 226-char remark
Show marketing remark (226 chars)
This cozy 3 bedroom ranch is waiting for some tender loving care. Family home, now awaits a new family. Deck, yard, detached 2 car garage on quiet neighborhood street. Immediate possession. Roof, furnace, A/C all 10 years old.
-
2014-12-11soldstatus $85,000
-
2014-09-15$89,500 226-char remark
Show marketing remark (226 chars)
This cozy 3 bedroom ranch is waiting for some tender loving care. Family home, now awaits a new family. Deck, yard, detached 2 car garage on quiet neighborhood street. Immediate possession. Roof, furnace, A/C all 10 years old.
ⓘ Source: listings_history table (triggers on properties + properties_extension) + one-shot
backfill from property_details.listing_events for pre-trigger history.
Tax reassessment forecast NY · Partial reset (capped growth)
- Current annual tax
- $5,342 · $445/mo
- Projected year-2 tax
- $5,342 · $445/mo
- Expected delta
- $0/yr ($0/mo · 0.0%)
ⓘ Screening estimate from a state-policy table — verify with the county assessor before closing.
Climate risk First Street
- Flood 1/10 Low FEMA zone X (unshaded) · 0% chance over 30 yrs
- Wildfire 1/10 Low
- Heat 2/10 Low 7 d/yr ≥95°F today · 15 d/yr by 30 yrs out
- Wind 1/10 Low
- Air quality 2/10 Low 1 unhealthy d/yr today · 1 by 30 yrs out
Nearby sold comps map
Loading sold comps map…
Walkable amenities ~0.75 mi
Loading nearby amenities…
Taxation est. · year 1
- Rental income
- $25,832
- − Mortgage interest
- −$12,603
- − Property taxes
- −$5,342
- − Insurance
- −$1,125
- − Repairs & maintenance
- −$2,067
- − Management
- −$2,067
- − Depreciation
- −$6,545
- Taxable loss
- −$3,917
- Est. tax savings @ 24.0%
- +$940
- After-tax cash flow
- $721/yr
For passive investors: Depreciation is non-cash, so a rental often shows a tax loss while cash-flowing — sheltering income. Rental losses are passive: they offset passive income freely, and up to $25,000/yr can offset ordinary (W-2) income if you actively participate and your MAGI is under $100k (phasing out to $0 by $150k); unused losses carry forward. On sale, claimed depreciation is recaptured at up to 25%, and gains may owe capital-gains tax (a 1031 exchange can defer both). Figures are a year-1 estimate at your 24.0% rate — not tax advice; consult a CPA.
Schools (NCES district)
- District
- Rush-Henrietta Central School District
- NCES district ID
- 3625170
- Math proficiency
- 62% ▼ -6.00%
- Reading proficiency
- 57% ▲ 1.00%
- Median HH income
- $58,682
- Composite
- 51.52/100
- National rank
- #1720
- State rank
- #237 of 590 in NY
Livability — Brighton
- Score
- 81/100
- State rank
- #89
- US rank
- #1379
Category grades
Schools grade is shown separately in the Schools card above.
Census & demographics
- County
- Monroe County · 674,131 people
- City population
- 38,703
- Metro
- Rochester, NY
- Population (ZIP)
- 26,032
- Household income
- $65,342
- Rent vs Own
- Severe rent burden
- 1161.0
Population outlook (Monroe County) Hauer SSP2
- Today (2025)
- 759,460 people
- By 2030
- 757,154 · -0.3%
- By 2040
- 740,644 · -2.5%
- By 2050
- 714,443 · -5.9%
- By 2075
- 645,883 · -15.0%
- By 2100
- 547,084 · -28.0%
Race, ethnicity, and origin ACS 2023
- Neighborhood character
- Predominantly White (67%)
- Race & ethnicity
- White 67% Asian 15% Black 8% Two or more races 6% Hispanic / Latino 6%
- Hispanic origin (detail)
- Puerto Rican 3%
- Common ancestry
- Romanian 4% Iranian 2% Lithuanian 2%
- Foreign-born
- 14% · China, Canada, Vietnam
- Languages at home
- 84% English-only · Chinese 4% Other Indo-European 3% Spanish 2%
Political lean MEDSL · Monroe
- 2024 margin
- D (+19.1) · D 59.5% · R 40.5%
- 2008→2024 swing
- +1.4pp toward D · 2008: 17.7pp · 2024: 19.1pp
- All cycles
- 2024: D+19.1 2020: D+21.0 2016: D+14.1 2012: D+17.4 2008: D+17.7
Not yet ingested
- Civics
- —
Market trends
- HPI YoY
- ▼ -180.68%
- Current HPI
- 262.8187
- Rent YoY
- ▲ 6.06%
- Metro
- Rochester, NY
- State GDP YoY
- ▲ 2.60%
- F500 in state
- 92
Industry mix (Fortune 500 HQ in NY)
| Industry | F500 HQs | Revenue |
|---|---|---|
| Financial Services | 10 | $950B |
|
||
| Consumer Goods | 9 | $162B |
|
||
| Insurance | 4 | $225B |
|
||
| Telecommunications | 2 | $144B |
|
||
| Pharmaceuticals | 2 | $112B |
|
||
| Media / Entertainment | 2 | $69B |
|
||
Price history
+151.4% since first listed5 events — show timeline
- 2026-05-15 Pending — UNYREIS
- 2026-05-06 Listed $225,000 UNYREIS
- 2014-12-12 Sold (MLS) $85,000 UNYREIS
- 2014-12-11 Sold (Public Records) $85,000 Public Records
- 2014-09-15 Listed $89,500 UNYREIS
Property tax history
+20.6%/yrLatest (2025): $5,342 · +22.2% YoY. Source: county tax records.
Cash-flow waterfall
monthlySold comps — $/sqft
last 12 mo · ≤1 miLoading sold comps…