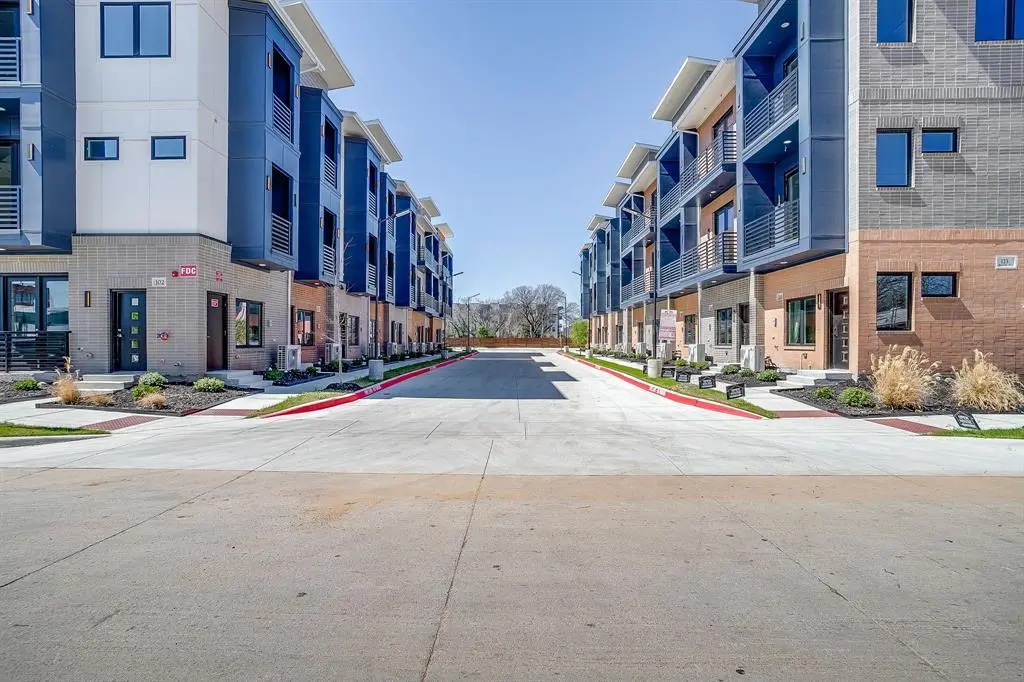
115 Merritt St
Fort Worth, TX 76114
$2,500,000B
36 bd · 90.0 ba ·
8,400 sqft ·
Built 2025
· MultiFamily
· Active
· 34 DOM
Cashflow @ list (25.0% down · 7.5%)
Estimated rent
$51,178/mo
Mortgage (P&I)
−$13,110
Tax + insurance
−$4,167
HOA
−$173
Vac / Maint / Mgmt
−$10,747
Net cashflow
$22,981/mo
Annual
$275,768/yr
Cap rate
17.32%
Cash-on-cash
39.40%
DSCR
2.75
1% rule
2.05%
Cash to close
$700,000
Investor read
- This is a 36 × 1-bed/?-bath units multifamily listed at $2.50M. Condition is rated excellent.
- At list price, monthly cash flow is $23k ($276k/yr) — positive. Per door: $638/mo.
- The deal already cash-flows at list — no discount required.
- Meets the 1% rule at list price ($51k rent vs $2.50M).
- It's been on market 34 days — a 3% lower offer ($2.42M) is reasonable based on typical stale-listing flexibility.
- Recommended offer: $2.42M (3.0% below list) — sets the bar for market timing.
- Local home prices are declining (-3.0%/yr); year-one equity from $17k of loan paydown is wiped out by about $75k of value loss. Plan a longer hold.
- Location reads 80/100 on livability (#49 in TX, #1,954 nationally) — a professional / high-income tenant draw. Strengths: amenities A+, cost of living A+, housing A+; Watch: crime F.
- Castleberry ISD (suburban): math 21% / reading 32% proficiency, ranked #701 of 826 in TX (top 85%) — low school quality limits family demand, transient renter base, plan for 1-2y turnover; 72% free/reduced lunch — lower-income household profile, screen leases tightly.
- Zoned schools: Castleberry El (math 17% / reading 26%, grade F, #3,470 of 4,322 statewide, top 81%, 747 students, 88% FRL) — zoned schools average 88% FRL vs 72% district-wide (15 pts higher); higher-poverty schools than district average — tighter screening recommended.
- Market conditions: Rents rising (+1.9%/yr); 152 active listings in the ZIP; 18,938 units permitted in Tarrant County in 2024 (8,336 in 5+ unit buildings).
- Tarrant County population projected at +41% by 2050 — long-run rental-demand tailwind backs the buy-and-hold thesis.
- 3 sale attempts with the ask held roughly flat each time — persistent listings suggest the price (not the market) is what's stuck; bring a comps-based counter.
- At projected returns (-3.0% appreciation + 1.9% rent growth), your $700k cash investment doubles in ~4 years — after that, you're playing with house money.
- Cap rate 17.3% vs local median 3.9% in Fort Worth — top-decile yield for the area; either an underpriced asset or a hidden risk that comps aren't pricing in. Stress-test before assuming the spread holds.
- At $51,178/mo this rent would consume 989% of the median local household income ($62k/yr) (locally 1095% of renters already pay >50% of income on rent) — very limited rent-growth headroom before tenants either downsize or default.
Questions for listing agent
- It's been on market 34 days. Have you received any prior offers? Is the seller open to a 3% concession, seller financing, or rate buy-down credit?
- Can we see the unit-by-unit rent roll, current vacancy, and any below-market leases? What's the average tenancy length?
- What capital expenditures (roof, boiler, parking lot, exteriors) have been made in the last 5 years, and what's planned in the next 2?
- What does the HOA fee cover, when was the last increase, and are there any pending special assessments or reserve-fund shortfalls?
- Is there a deadline driving the sale (1031 exchange, divorce, estate, relocation)? That informs how much negotiation room exists.
- Schools are D-rated, which usually means shorter tenancies and higher turnover. Who's the typical renter profile here, and what's been the actual vacancy rate?
- Crime grade is F in this area — have there been break-ins, vandalism, or insurance claims at this property in the last 3 years? What carrier currently insures it and at what premium?
- What's the average days-on-market for RENTAL listings here right now (not sales)? A rising rental-DOM trend means longer vacancies and softer asking-rent achievability than the comps imply.
CashFlowRE · CFR-W418EY7K8JB386
· Data 6 h ago
cashflowre.app · 2026-05-29