 36-Plex
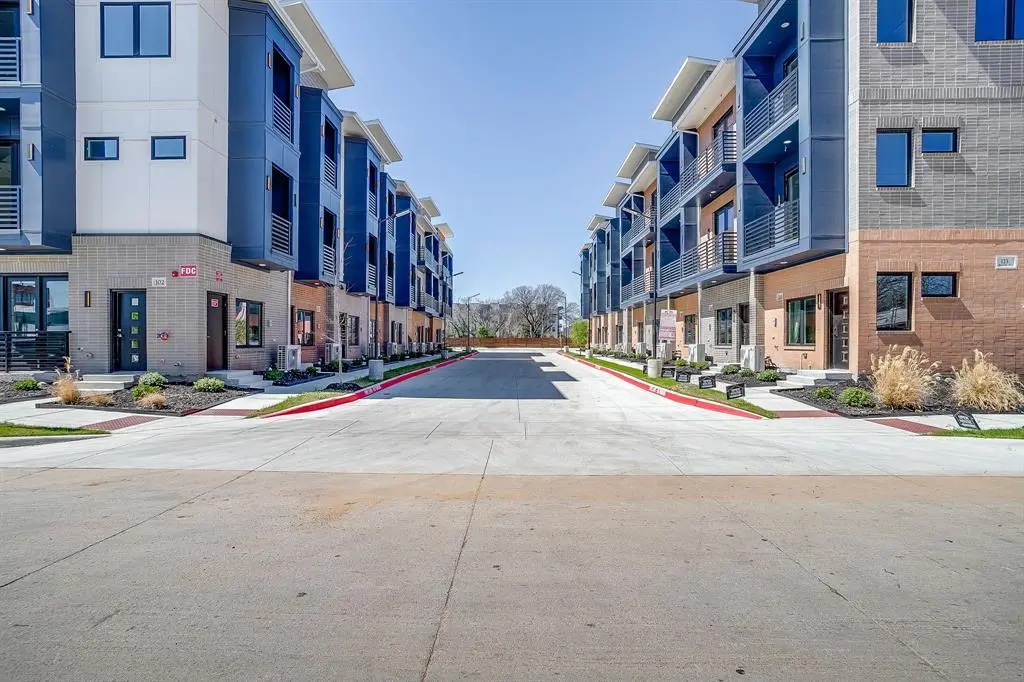
115 Merritt St · Fort Worth, TX
Flood risk No data
- FEMA flood zone
- —
- Chance of flooding over 30 yrs
- —
- Est. flood insurance / yr
- —
Fire risk No data
- Est. fire insurance / yr
- —
Heat risk No data
- Hot days now (above threshold)
- —
- Hot days in 30 yrs
- —
Wind risk No data
- Chance of severe wind over 30 yrs
- —
Air-quality risk No data
- Unhealthy air days now
- —
- Unhealthy air days in 30 yrs
- —
Risk factors via First Street. Map © Google.
Why this score? — see what drove the B grade
The composite is a weighted blend of 9 inputs, each scored 0–100. Each bar is that input's sub-score; the figure is the points it added to the 100-point composite (weight × sub-score).
- Cash flow +30.0/30.0
- 1% rule +10.0/10.0
- DSCR +10.0/10.0
- ARV discount +7.5/15.0
- Condition / age +5.0/5.0
- Livability +4.0/5.0
- Rent growth +3.0/5.0
- Schools +2.2/10.0
- Appreciation +0.0/10.0
$2,500,000
🖨 Deal sheet 📄 Offer letter ✓ Due diligence
Multi-family units
County records classify this as Multi-Family (5+ Unit). Listing-text estimate: 36 units. confirmed
5+ unit building — per-unit beds/baths from public records are typically unavailable; the breakdown below (if shown) is an estimate from the listing text.
Listing remarks MLS
Discover modern comfort at the Merritt Street Condominiums. These 2-bedroom, 2.5-bathroom condos offer stylish interiors with open layouts, sleek kitchens, and in-unit laundry connections. Excellent location near various retailers and Castleberry High School with quick access to 183, I-30, and Downtown Fort Worth. We ENCOURAGE ALL OFFERS! Owner can potentially offer incentives pending offer!
Key facts
- Cultural district
- 0.97 acre lot
- 8 parking spots
Tags
Property features AI
Finance
- Other: Tenancy allows pets; Operating expense responsibilities include insurance, maintenance, payroll, management and utilities
- Financial info: Property marketed for cash or 1031 exchange; Cap rate approximately 4.45%; Multi-unit income property: 1 building with 8 total units, 100% occupancy; Gross annual income approximately $185,760; Gross annual expenses approximately $74,395 (includes insurance, maintenance, payroll, professional management, utilities); Insurance expense approximately $6,888; Net operating income approximately $111,365
- HOA & community: Mandatory association with monthly fee (approximately $173); HOA covers front yard maintenance, grounds and structure maintenance, pest control, sewer and water; HOA managed by Touchstone Property Management
Exterior
- Parking: 8 parking spaces in an on-site, lighted concrete parking lot (open/common)
- Security: Smoke detector(s)
- Utilities: City water; City sewer; Individual gas meters; Individual water meters; Underground utilities; Sidewalks and curbs; Community mailbox
- Home design: Residential income property (apartment); Three or more levels; New construction completed in 2025; Perimeter fencing in the community; Subdivision: Hassett Gardens Add; Complex: The Merritt Condominiums
- Construction: Brick construction; Composition roof; Slab foundation; Building area approximately 8,400
- Exterior features: Balcony; Covered porches; Covered patio
Interior
- Kitchen: Dishwasher; Disposal; Electric range; Microwave; Refrigerator; Kitchen island
- Bedrooms: 12 bedrooms
- Flooring: Luxury vinyl plank; Tile
- Bathrooms: 16 total bathrooms (12 full, 4 half)
- Heating & cooling: Central heating; Central air
- Interior features: Cable TV available; High-speed internet available; Decorative lighting; Kitchen island; Multiple staircases; Pantry; Walk-in closets
- Laundry & utility: Gas water heater; Tankless water heater
Neighborhood map
What this means for you Summary
Snapshot
- This is a 36 × 1-bed/?-bath units multifamily listed at $2.50M. Condition is rated excellent.
Deal economics
- At list price, monthly cash flow is $22k ($264k/yr) — positive. Per door: $612/mo.
- The deal already cash-flows at list — no discount required.
- Meets the 1% rule at list price ($50k rent vs $2.50M).
- Recommended offer: $2.42M (3.0% below list) — sets the bar for market timing.
- Cap rate 16.9% vs local median 3.9% in Fort Worth — top-decile yield for the area; either an underpriced asset or a hidden risk that comps aren't pricing in. Stress-test before assuming the spread holds.
Location & tenants
- Location reads 80/100 on livability (#49 in TX, #1,954 nationally) — a professional / high-income tenant draw. Strengths: amenities A+, cost of living A+, housing A+; Watch: crime F.
- Castleberry ISD (suburban): math 21% / reading 32% proficiency, ranked #701 of 826 in TX (top 85%) — low school quality limits family demand, transient renter base, plan for 1-2y turnover; 72% free/reduced lunch — lower-income household profile, screen leases tightly.
- Zoned schools: Castleberry El (math 17% / reading 26%, grade F, #3,470 of 4,322 statewide, top 81%, 747 students, 88% FRL) — zoned schools average 88% FRL vs 72% district-wide (15 pts higher); higher-poverty schools than district average — tighter screening recommended.
- Market conditions: Rents rising (+1.9%/yr); 153 active listings in the ZIP; 18,938 units permitted in Tarrant County in 2024 (8,336 in 5+ unit buildings).
- At $49,979/mo this rent would consume 966% of the median local household income ($62k/yr) (locally 1095% of renters already pay >50% of income on rent) — very limited rent-growth headroom before tenants either downsize or default.
Forward outlook
- Local home prices are declining (-3.0%/yr); year-one equity from $17k of loan paydown is wiped out by about $75k of value loss. Plan a longer hold.
- Tarrant County population projected at +41% by 2050 — long-run rental-demand tailwind backs the buy-and-hold thesis.
- At projected returns (-3.0% appreciation + 1.9% rent growth), your $700k cash investment doubles in ~4 years — after that, you're playing with house money.
Negotiation context
- It's been on market 31 days — a 3% lower offer ($2.42M) is reasonable based on typical stale-listing flexibility.
- 3 sale attempts with the ask held roughly flat each time — persistent listings suggest the price (not the market) is what's stuck; bring a comps-based counter.
Questions for the listing agent
- It's been on market 31 days. Have you received any prior offers? Is the seller open to a 3% concession, seller financing, or rate buy-down credit?
- Can we see the unit-by-unit rent roll, current vacancy, and any below-market leases? What's the average tenancy length?
- What capital expenditures (roof, boiler, parking lot, exteriors) have been made in the last 5 years, and what's planned in the next 2?
- What does the HOA fee cover, when was the last increase, and are there any pending special assessments or reserve-fund shortfalls?
- Is there a deadline driving the sale (1031 exchange, divorce, estate, relocation)? That informs how much negotiation room exists.
- Schools are D-rated, which usually means shorter tenancies and higher turnover. Who's the typical renter profile here, and what's been the actual vacancy rate?
- Crime grade is F in this area — have there been break-ins, vandalism, or insurance claims at this property in the last 3 years? What carrier currently insures it and at what premium?
- What's the average days-on-market for RENTAL listings here right now (not sales)? A rising rental-DOM trend means longer vacancies and softer asking-rent achievability than the comps imply.
- What's the recent tenant-quality profile in this submarket — average credit score on applications, eviction rate, late-payment / NSF rate, and stable-employment percentage? A property-management company in the area should have these aggregated.
- How much new apartment / multifamily construction is in the pipeline within 1–3 miles? Heavy new supply (>2% of stock underway) typically softens rents 12–24 months out; light construction supports rent growth.
Investment metrics
- 1% rule
- 2.00% ✓
- Cap rate
- 16.87%
- Cash-on-cash
- 37.77%
- DSCR
- 2.68
- GRM
- 4.2
CMA / ARV
No comps found within radius.
Projected returns pro-forma
-3.0% appreciation · 1.88% rent growth · sell at horizon
- IRR
- 32.5%
- Equity multiple
- 2.35×
- Total profit
- $943,373
- Equity at exit
- $372,758
- IRR
- 38.9%
- Equity multiple
- 4.44×
- Total profit
- $2,408,497
- Equity at exit
- $216,154
Cash invested: $700,000 (down + closing). Projections, not guarantees.
Landlord ↔ Tenant lean methodology
- Overall (STATE)
- 87 Strongly Landlord-Friendly
- State Texas
- 87 Strongly Landlord-Friendly · R+5
- County
- — inherits STATE
- City
- — inherits STATE
ZIP-level market 76114
- Home prices YoY
- -24.3%
- Rents YoY
- 1.9%
- Active inventory
- 153
- Price-to-rent
- 150.1×
Monthly cashflow live
- Estimated rent
- $49,979 high interval (Pro) →
- Mortgage (P&I)
- −$13,110
- Tax est. 1.5%
- −$3,125 /mo · $37,500/yr
- Insurance
- −$1,042
- HOA
- −$173
- Vacancy / Maint / Mgmt
- −$10,496
- Net cashflow
- $22,033
Break-even live
36-unit breakdown (identical units grouped — click to expand)
| Units | Beds | Baths | Est. rent |
|---|---|---|---|
| 36× units | 1 | — | $49,968 |
| #1 | 1 | — | $1,388 |
| #2 | 1 | — | $1,388 |
| #3 | 1 | — | $1,388 |
| #4 | 1 | — | $1,388 |
| #5 | 1 | — | $1,388 |
| #6 | 1 | — | $1,388 |
| #7 | 1 | — | $1,388 |
| #8 | 1 | — | $1,388 |
| #9 | 1 | — | $1,388 |
| #10 | 1 | — | $1,388 |
| #11 | 1 | — | $1,388 |
| #12 | 1 | — | $1,388 |
| #13 | 1 | — | $1,388 |
| #14 | 1 | — | $1,388 |
| #15 | 1 | — | $1,388 |
| #16 | 1 | — | $1,388 |
| #17 | 1 | — | $1,388 |
| #18 | 1 | — | $1,388 |
| #19 | 1 | — | $1,388 |
| #20 | 1 | — | $1,388 |
| #21 | 1 | — | $1,388 |
| #22 | 1 | — | $1,388 |
| #23 | 1 | — | $1,388 |
| #24 | 1 | — | $1,388 |
| #25 | 1 | — | $1,388 |
| #26 | 1 | — | $1,388 |
| #27 | 1 | — | $1,388 |
| #28 | 1 | — | $1,388 |
| #29 | 1 | — | $1,388 |
| #30 | 1 | — | $1,388 |
| #31 | 1 | — | $1,388 |
| #32 | 1 | — | $1,388 |
| #33 | 1 | — | $1,388 |
| #34 | 1 | — | $1,388 |
| #35 | 1 | — | $1,388 |
| #36 | 1 | — | $1,388 |
| Total (36 units) | $49,979 | ||
UW: 25.0% down · 7.5% · 30yr · 1.5% tax · 5.0% vac · 8.0% maint · 8.0% mgmt
Financing live
Cash to close
- Down payment
- $625,000
- Closing costs
- $75,000
- Reserves months
- —
- Total cash needed
- —
Loan-product check · same deal, 3 products live
Conventional
25% down · 7.5% · 30yr
- Down + closing
- —
- Monthly P&I
- —
- Monthly cashflow
- —
- DSCR
- —
- Eligible?
- —
Personal DTI + credit; lowest rate.
DSCR
20% down · 8.5% · 30yr
- Down + closing
- —
- Monthly P&I
- —
- Monthly cashflow
- —
- DSCR
- —
- Eligible?
- —
No personal income docs; deal must DSCR.
Hard money
10% down · 12.0% · 12mo
- Down + closing
- —
- Monthly P&I
- —
- Monthly cashflow
- —
- DSCR
- —
- Eligible?
- —
Short-term bridge; refi at stabilization.
HOA detail
- Monthly dues
- $173 · $2,076/yr
Listing history 19 events
-
2026-06-18days on market $2,500,000 Active 31 DOM
-
2026-06-17days on market $2,500,000 Active 30 DOM
-
2026-06-16days on market $2,500,000 Active 29 DOM
-
2026-06-15days on market $2,500,000 Active 28 DOM
-
2026-06-13days on market $2,500,000 Active 26 DOM
-
2026-06-13days on market $2,500,000 Active 25 DOM
-
2026-06-09days on market $2,500,000 Active 22 DOM
-
2026-06-08days on market $2,500,000 Active 21 DOM
-
2026-06-07days on market $2,500,000 Active 20 DOM
-
2026-06-04days on market $2,500,000 Active 17 DOM
-
2026-06-03days on market $2,500,000 Active 16 DOM
-
2026-06-02days on market $2,500,000 Active 15 DOM
-
2026-06-01days on market $2,500,000 Active 14 DOM
-
2026-05-31days on market $2,500,000 Active 13 DOM
-
2026-05-18$2,500,000 Active
-
2026-01-27soldstatus Closed 394-char remark
Show marketing remark (394 chars)
Discover modern comfort at the Merritt Street Condominiums. These 2-bedroom, 2.5-bathroom condos offer stylish interiors with open layouts, sleek kitchens, and in-unit laundry connections. Excellent location near various retailers and Castleberry High School with quick access to 183, I-30, and Downtown Fort Worth. We ENCOURAGE ALL OFFERS! Owner can potentially offer incentives pending offer!
-
2026-01-09$380,000 Active 394-char remark
Show marketing remark (394 chars)
Discover modern comfort at the Merritt Street Condominiums. These 2-bedroom, 2.5-bathroom condos offer stylish interiors with open layouts, sleek kitchens, and in-unit laundry connections. Excellent location near various retailers and Castleberry High School with quick access to 183, I-30, and Downtown Fort Worth. We ENCOURAGE ALL OFFERS! Owner can potentially offer incentives pending offer!
-
2025-10-21historical
-
2025-06-06$2,240,000 Active
ⓘ Source: listings_history table (triggers on properties + properties_extension) + one-shot
backfill from property_details.listing_events for pre-trigger history.
Nearby sold comps map
Loading sold comps map…
Walkable amenities ~0.75 mi
Loading nearby amenities…
Taxation est. · year 1
- Rental income
- $599,748
- − Mortgage interest
- −$140,039
- − Property taxes
- −$37,500
- − Insurance
- −$12,500
- − Repairs & maintenance
- −$47,980
- − Management
- −$47,980
- − HOA
- −$2,076
- − Depreciation
- −$72,727
- Taxable income
- $238,946
- Est. tax owed @ 24.0%
- −$57,347
- After-tax cash flow
- $207,055/yr
For passive investors: Depreciation is non-cash, so a rental often shows a tax loss while cash-flowing — sheltering income. Rental losses are passive: they offset passive income freely, and up to $25,000/yr can offset ordinary (W-2) income if you actively participate and your MAGI is under $100k (phasing out to $0 by $150k); unused losses carry forward. On sale, claimed depreciation is recaptured at up to 25%, and gains may owe capital-gains tax (a 1031 exchange can defer both). Figures are a year-1 estimate at your 24.0% rate — not tax advice; consult a CPA.
Condition & rehab AI · 12 photos
This modern, move-in-ready multi-family property in the heart of The River District is in excellent condition with no visible repairs needed. Ideal for investors seeking a prime opportunity to own income-producing property in a high-demand area.
Value-add opportunities
- Both Landscaping improvements — Enhances curb appeal and adds value
- Both Interior updates — Modernizes interior and enhances appeal
- Both Appliance upgrades — Improves functionality and appeal
Renovation cost estimate screening
Value-add ROI direction
- Both Landscaping improvements — Enhances curb appeal and adds value ↑
- Both Interior updates — Modernizes interior and enhances appeal ↑
- Both Appliance upgrades — Improves functionality and appeal ↑
ⓘ Cost ranges are severity-bucket heuristics (US national rule-of-thumb). Get contractor quotes + a written scope before underwriting a rehab budget.
Schools (NCES district)
- District
- Castleberry ISD
- NCES district ID
- 4813170
- Math proficiency
- 21% ▼ -17.00%
- Reading proficiency
- 32% ▼ -5.00%
- Median HH income
- $39,060
- Composite
- 22.22/100
- National rank
- #8152
- State rank
- #701 of 826 in TX
Livability — Fort Worth
- Score
- 80/100
- State rank
- #49
- US rank
- #1954
Category grades
Schools grade is shown separately in the Schools card above.
Census & demographics
- Census place
- Fort Worth, TX
- County
- Tarrant County · 2,033,669 people
- City population
- 911,619
- Metro
- Dallas-Fort Worth-Arlington, TX
- Population (ZIP)
- 27,357
- Household income
- $62,073
- Rent vs Own
- Severe rent burden
- 1095.0
Population outlook (Tarrant County) Hauer SSP2
- Today (2025)
- 2,380,417 people
- By 2030
- 2,578,900 · +8.3%
- By 2040
- 2,974,995 · +25.0%
- By 2050
- 3,350,489 · +40.8%
- By 2075
- 4,216,909 · +77.2%
- By 2100
- 4,741,527 · +99.2%
Race, ethnicity, and origin ACS 2023
- Neighborhood character
- Majority Hispanic (61%)
- Race & ethnicity
- Hispanic / Latino 61% White 35% Two or more races 20% Native American 3% Black 2%
- Hispanic origin (detail)
- Mexican 56%
- Common ancestry
- Slovak 2% Italian 1% Serbian 1%
- Foreign-born
- 17% · Canada
- Languages at home
- 54% English-only · Spanish 45%
Political lean MEDSL · Tarrant
- 2024 margin
- Lean R (+5.1) · D 46.7% · R 51.9% · Other 1.4%
- 2008→2024 swing
- +6.6pp toward D · 2008: -11.7pp · 2024: -5.1pp
- All cycles
- 2024: R+5.1 2020: D+0.2 2016: R+8.7 2012: R+15.7 2008: R+11.7
Not yet ingested
- Civics
- —
Market trends
- HPI YoY
- ▼ -117.88%
- Current HPI
- 366.5263
- Rent YoY
- ▲ 1.88%
- Metro
- Dallas-Fort Worth-Arlington, TX
- State GDP YoY
- ▲ 3.95%
- F500 in state
- 110
Industry mix (Fortune 500 HQ in TX)
| Industry | F500 HQs | Revenue |
|---|---|---|
| Energy | 16 | $1,198B |
|
||
| Technology | 5 | $198B |
|
||
| Engineering / Construction | 4 | $72B |
|
||
| Energy Services | 3 | $60B |
|
||
| Utilities | 3 | $41B |
|
||
| Healthcare | 2 | $330B |
|
||
Price history
+11.6% since first listed5 events — show timeline
- 2026-05-18 Listed $2,500,000 NTREIS
- 2026-01-27 Sold (MLS) — NTREIS
- 2026-01-09 Listed $380,000 NTREIS
- 2025-10-21 Listing Removed — NTREIS
- 2025-06-06 Listed $2,240,000 NTREIS
Cash-flow waterfall
monthlySold comps — $/sqft
last 12 mo · ≤1 miLoading sold comps…