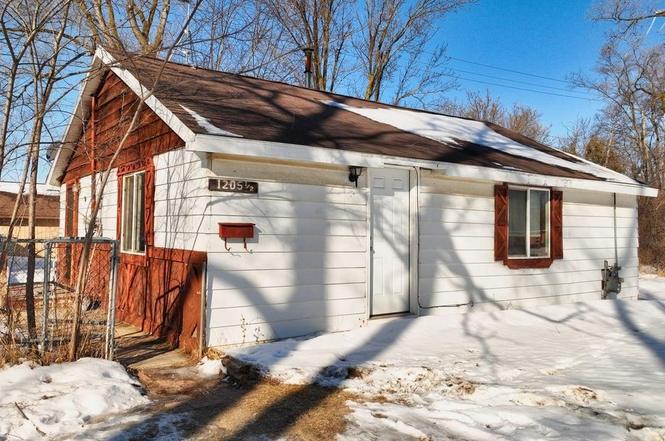
1205 N Kinney Ave
Mount Pleasant, MI 48858
$84,900B
2 bd · 1.0 ba ·
803 sqft ·
Built 1913
· SingleFamily
· Active
· 124 DOM
Cashflow @ list (25.0% down · 7.5%)
Estimated rent
$996/mo
Mortgage (P&I)
−$445
Tax + insurance
−$129
HOA
−$0
Vac / Maint / Mgmt
−$209
Net cashflow
$212/mo
Annual
$2,546/yr
Cap rate
9.29%
Cash-on-cash
10.71%
DSCR
1.48
1% rule
1.17%
Cash to close
$23,772
Investor read
- This is a 2-bed/1.0-bath single-family listed at $85k.
- At list price, monthly cash flow is $212 ($3k/yr) — positive.
- The deal already cash-flows at list — no discount required.
- Meets the 1% rule at list price ($996 rent vs $85k).
- It's been on market 124 days — a 12% lower offer ($75k) is reasonable based on typical stale-listing flexibility.
- Recommended offer: $75k (12.0% below list) — sets the bar for market timing.
- Local home prices are declining (-3.0%/yr); year-one equity from $587 of loan paydown is wiped out by about $3k of value loss. Plan a longer hold.
- Location reads 82/100 on livability (#55 in MI, #1,063 nationally) — a professional / high-income tenant draw. Strengths: amenities A+, cost of living A+, health & safety A+; Watch: crime C-, employment F.
- Mt. Pleasant City School District (town): math 33% / reading 48% proficiency, ranked #229 of 540 in MI (top 42%) — families likely to look elsewhere, expect single-tenant / working-renter base with shorter leases.
- Zoned schools: Pullen Elementary School (327 students, 68% FRL); Fancher School (math 44% / reading 56%, grade D+, #371 of 1,397 statewide, top 27%, 406 students, 47% FRL); Mt Pleasant Senior High School (math 42% / reading 57%, grade D, #154 of 713 statewide, top 25%, 1,058 students, 42% FRL) — zoned schools average 53% FRL vs 36% district-wide (16 pts higher); higher-poverty schools than district average — tighter screening recommended.
- Watch-outs: built in 1913 — expect roof / HVAC / electrical / plumbing capex.
- Market conditions: Rents rising fast (+16.9%/yr); 251 active listings in the ZIP; 72 units permitted in Isabella County in 2024 (0 in 5+ unit buildings).
- Isabella County population projected at +9% by 2050 — modest demand growth; plan on rents tracking national, not racing it.
- 2 sale attempts with the ask held roughly flat each time — persistent listings suggest the price (not the market) is what's stuck; bring a comps-based counter.
- At projected returns (-3.0% appreciation + 8.0% rent growth), your $24k cash investment doubles in ~7 years — after that, you're playing with house money.
- Cap rate 9.3% vs local median 3.3% in Mount Pleasant — top-decile yield for the area; either an underpriced asset or a hidden risk that comps aren't pricing in. Stress-test before assuming the spread holds.
Questions for listing agent
- It's been on market 124 days. Have you received any prior offers? Is the seller open to a 12% concession, seller financing, or rate buy-down credit?
- Built in 1913 — when were the roof, HVAC, electrical panel, plumbing, and water heater last replaced?
- Why hasn't it sold? Are there any deal-killer items the seller is aware of (foundation, flood, title, zoning, code violations)?
- Is there a deadline driving the sale (1031 exchange, divorce, estate, relocation)? That informs how much negotiation room exists.
- Schools are B-rated — typically a magnet for longer-tenancy family renters. What's the average tenant stay here, and is there a school-zone premium baked into asking?
- What's the average days-on-market for RENTAL listings here right now (not sales)? A rising rental-DOM trend means longer vacancies and softer asking-rent achievability than the comps imply.
- What's the recent tenant-quality profile in this submarket — average credit score on applications, eviction rate, late-payment / NSF rate, and stable-employment percentage? A property-management company in the area should have these aggregated.
- How much new for-sale + rental construction is in the pipeline within 1–3 miles? Heavy new supply typically softens prices + rents 12–24 months out; constrained supply supports both.
CashFlowRE · CFR-W4QDKGBYM1VSVF
· Data 6 h ago
cashflowre.app · 2026-05-29