 🏷️ Likely Rental
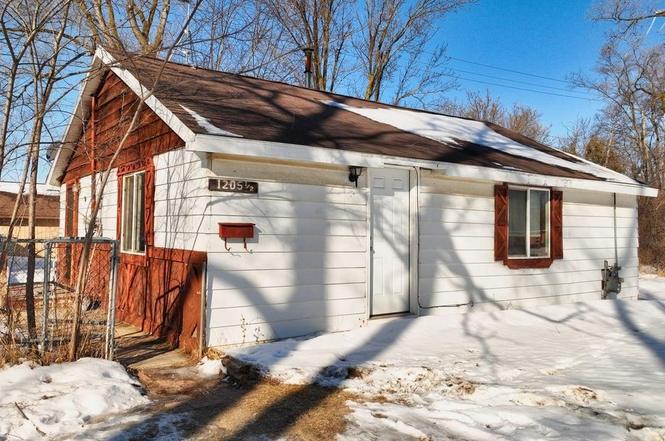
1205 N Kinney Ave · Mount Pleasant, MI
Flood risk 1/10 · Minimal
- FEMA flood zone
- X (unshaded)
- Chance of flooding over 30 yrs
- 0.0%
- Est. flood insurance / yr
- $507 – $1,088
Fire risk 1/10 · Minimal
- Est. fire insurance / yr
- $784 – $1,456
Heat risk 3/10 · Minor
- Hot days now (above 98°F)
- 7 days/yr
- Hot days in 30 yrs
- 14 days/yr
Wind risk 1/10 · Minimal
- Chance of severe wind over 30 yrs
- —
Air-quality risk 2/10 · Minimal
- Unhealthy air days now
- 1 days/yr
- Unhealthy air days in 30 yrs
- 2 days/yr
Risk factors via First Street. Map © Google.
Why this score? — see what drove the B grade
The composite is a weighted blend of 9 inputs, each scored 0–100. Each bar is that input's sub-score; the figure is the points it added to the 100-point composite (weight × sub-score).
- Cash flow +26.0/30.0
- ARV discount +15.0/15.0
- DSCR +8.8/10.0
- 1% rule +6.7/10.0
- Rent growth +5.0/5.0
- Livability +4.1/5.0
- Schools +3.3/10.0
- Condition / age +2.5/5.0
- Appreciation +0.0/10.0
$84,900
🖨 Deal sheet (PDF) 📄 Offer letter ✓ Due diligence
Listing remarks MLS
Welcome to 1205 N. Kinney Ave! Now is the time to forgo apartment life, and enter into home ownership. This is also the perfect investment property with a strong 15-year (licensed) rental history, currently utilizing a month-to-month lease. The open concept floorplan lends to making the most of a compact, efficient space. The yard is generous with plenty of room for changes to the property.
Key facts
- Generous yard
- 0.23 acre lot
- Built 1913
Tags
Property features AI
Exterior
- Utilities: Public water; Shared septic sewer
- Home design: Single-family residence; One story
- Construction: Vinyl siding; Built with crawl space foundation
- Exterior features: Gravel road access; Lot dimensions approximately 152.7 x 62.3; Approximately 0.23–acre lot; Residential zoning
Interior
- Kitchen: Oven; Range; Refrigerator
- Bedrooms: Total of 6 rooms (includes bedrooms and living spaces)
- Bathrooms: 1 full bathroom
- Heating & cooling: Forced air heating; Natural gas heating; No central cooling
- Interior features: Oven; Refrigerator; Range; Crawl space basement
- Laundry & utility: Has heating system
Neighborhood map
What this means for you Summary
Snapshot
- This is a 2-bed/1.0-bath single-family listed at $85k.
Deal economics
- At list price, monthly cash flow is $212 ($3k/yr) — positive.
- The deal already cash-flows at list — no discount required.
- Meets the 1% rule at list price ($996 rent vs $85k).
- Recommended offer: $75k (12.0% below list) — sets the bar for market timing.
- Cap rate 9.3% vs local median 3.3% in Mount Pleasant — top-decile yield for the area; either an underpriced asset or a hidden risk that comps aren't pricing in. Stress-test before assuming the spread holds.
Location & tenants
- Location reads 82/100 on livability (#55 in MI, #1,063 nationally) — a professional / high-income tenant draw. Strengths: amenities A+, cost of living A+, health & safety A+; Watch: crime C-, employment F.
- Mt. Pleasant City School District (town): math 33% / reading 48% proficiency, ranked #229 of 540 in MI (top 42%) — families likely to look elsewhere, expect single-tenant / working-renter base with shorter leases.
- Zoned schools: Pullen Elementary School (327 students, 68% FRL); Fancher School (math 44% / reading 56%, grade D+, #371 of 1,397 statewide, top 27%, 406 students, 47% FRL); Mt Pleasant Senior High School (math 42% / reading 57%, grade D, #154 of 713 statewide, top 25%, 1,058 students, 42% FRL) — zoned schools average 53% FRL vs 36% district-wide (16 pts higher); higher-poverty schools than district average — tighter screening recommended.
- Market conditions: Rents rising fast (+16.9%/yr); 251 active listings in the ZIP; 72 units permitted in Isabella County in 2024 (0 in 5+ unit buildings).
Forward outlook
- Local home prices are declining (-3.0%/yr); year-one equity from $587 of loan paydown is wiped out by about $3k of value loss. Plan a longer hold.
- Isabella County population projected at +9% by 2050 — modest demand growth; plan on rents tracking national, not racing it.
- At projected returns (-3.0% appreciation + 8.0% rent growth), your $24k cash investment doubles in ~7 years — after that, you're playing with house money.
Negotiation context
- It's been on market 124 days — a 12% lower offer ($75k) is reasonable based on typical stale-listing flexibility.
- 2 sale attempts with the ask held roughly flat each time — persistent listings suggest the price (not the market) is what's stuck; bring a comps-based counter.
Risks & watch-outs
- Watch-outs: built in 1913 — expect roof / HVAC / electrical / plumbing capex.
Questions for the listing agent
- It's been on market 124 days. Have you received any prior offers? Is the seller open to a 12% concession, seller financing, or rate buy-down credit?
- Built in 1913 — when were the roof, HVAC, electrical panel, plumbing, and water heater last replaced?
- Why hasn't it sold? Are there any deal-killer items the seller is aware of (foundation, flood, title, zoning, code violations)?
- Is there a deadline driving the sale (1031 exchange, divorce, estate, relocation)? That informs how much negotiation room exists.
- Schools are B-rated — typically a magnet for longer-tenancy family renters. What's the average tenant stay here, and is there a school-zone premium baked into asking?
- What's the average days-on-market for RENTAL listings here right now (not sales)? A rising rental-DOM trend means longer vacancies and softer asking-rent achievability than the comps imply.
- What's the recent tenant-quality profile in this submarket — average credit score on applications, eviction rate, late-payment / NSF rate, and stable-employment percentage? A property-management company in the area should have these aggregated.
- How much new for-sale + rental construction is in the pipeline within 1–3 miles? Heavy new supply typically softens prices + rents 12–24 months out; constrained supply supports both.
Investment metrics
- 1% rule
- 1.17% ✓
- Cap rate
- 9.29%
- Cash-on-cash
- 10.71%
- DSCR
- 1.48
- GRM
- 7.1
CMA / ARV
- ARV (on-the-fly)
- $125,268
- Comps found
- 4
Show comp detail 4 sales within ~0.75 mi
| Address | Dist | Beds/Ba | Sqft | Sold | Price | $/sf | Match |
|---|---|---|---|---|---|---|---|
| 1007 N Kinney Ave | 0.12mi | 2/1.0 | 814 (+1%) | 5mo | $60,000 | $74 | 88 |
| 517 E Bennett Ave | 0.32mi | 2/1.0 | 720 (-10%) | 2mo | $101,000 | $140 | 66 |
| 212 Palmer St | 0.35mi | 2/1.0 | 720 (-10%) | 11mo | $112,000 | $156 | 57 |
| 1110 Crosslanes St | 0.61mi | 2/1.0 | 718 (-11%) | 12mo | $142,000 | $198 | 44 |
Match score weights: distance 35% · size 25% · config 20% · recency 20%. Top-matched comps best support the ARV.
Projected returns pro-forma
-3.0% appreciation · 8.0% rent growth · sell at horizon
- IRR
- 5.2%
- Equity multiple
- 1.21×
- Total profit
- $5,024
- Equity at exit
- $12,659
- IRR
- 18.7%
- Equity multiple
- 2.92×
- Total profit
- $45,751
- Equity at exit
- $7,341
Cash invested: $23,772 (down + closing). Projections, not guarantees.
Landlord ↔ Tenant lean methodology
- Overall (STATE)
- 62 Landlord-Friendly
- State Michigan
- 62 Landlord-Friendly · EVEN
- County
- — inherits STATE
- City
- — inherits STATE
ZIP-level market 48858
- Home prices YoY
- -31.9%
- Rents YoY
- 16.9%
- Active inventory
- 251
- Price-to-rent
- 7.1×
Monthly cashflow live
- Estimated rent
- $996 medium interval (Pro) →
- Mortgage (P&I)
- −$445
- Tax from tax record
- −$94 /mo · $1,125/yr
- Insurance
- −$35
- HOA
- −$0
- Vacancy / Maint / Mgmt
- −$209
- Net cashflow
- $212
Break-even live
Sensitivity live
| Price | -10% $260 | -5% $236 | +0% $212 | +5% $188 | +10% $164 |
|---|---|---|---|---|---|
| Rent | -10% $134 | -5% $173 | +0% $212 | +5% $251 | +10% $291 |
| Rate | -1.0pp $255 | -0.5pp $234 | base $212 | +0.5pp $190 | +1.0pp $168 |
UW: 25.0% down · 7.5% · 30yr · 1.5% tax · 5.0% vac · 8.0% maint · 8.0% mgmt
Financing live
Cash to close
- Down payment
- $21,225
- Closing costs
- $2,547
- Reserves months
- —
- Total cash needed
- —
Loan-product check · same deal, 3 products live
Conventional
25% down · 7.5% · 30yr
- Down + closing
- —
- Monthly P&I
- —
- Monthly cashflow
- —
- DSCR
- —
- Eligible?
- —
Personal DTI + credit; lowest rate.
DSCR
20% down · 8.5% · 30yr
- Down + closing
- —
- Monthly P&I
- —
- Monthly cashflow
- —
- DSCR
- —
- Eligible?
- —
No personal income docs; deal must DSCR.
Hard money
10% down · 12.0% · 12mo
- Down + closing
- —
- Monthly P&I
- —
- Monthly cashflow
- —
- DSCR
- —
- Eligible?
- —
Short-term bridge; refi at stabilization.
Listing history 20 events
-
2026-06-22days on market $84,900 Active 124 DOM
-
2026-06-21days on market $84,900 Active 123 DOM
-
2026-06-19days on market $84,900 Active 121 DOM
-
2026-06-18days on market $84,900 Active 120 DOM
-
2026-06-17days on market $84,900 Active 119 DOM
-
2026-06-16days on market $84,900 Active 118 DOM
-
2026-06-15days on market $84,900 Active 117 DOM
-
2026-06-14days on market $84,900 Active 115 DOM
-
2026-06-12days on market $84,900 Active 114 DOM
-
2026-06-09days on market $84,900 Active 111 DOM
-
2026-06-08days on market $84,900 Active 110 DOM
-
2026-06-07days on market $84,900 Active 109 DOM
-
2026-06-05days on market $84,900 Active 106 DOM
-
2026-06-03days on market $84,900 Active 105 DOM
-
2026-06-02days on market $84,900 Active 104 DOM
-
2026-06-01days on market $84,900 Active 103 DOM
-
2026-05-31days on market $84,900 Active 102 DOM
-
2026-05-30days on market $84,900 Active 101 DOM
-
2026-02-18$84,900 Active
Show marketing remark (393 chars)
Welcome to 1205 N. Kinney Ave! Now is the time to forgo apartment life, and enter into home ownership. This is also the perfect investment property with a strong 15-year (licensed) rental history, currently utilizing a month-to-month lease. The open concept floorplan lends to making the most of a compact, efficient space. The yard is generous with plenty of room for changes to the property.
-
2026-02-18$84,900 Active 393-char remark
Show marketing remark (393 chars)
Welcome to 1205 N. Kinney Ave! Now is the time to forgo apartment life, and enter into home ownership. This is also the perfect investment property with a strong 15-year (licensed) rental history, currently utilizing a month-to-month lease. The open concept floorplan lends to making the most of a compact, efficient space. The yard is generous with plenty of room for changes to the property.
ⓘ Source: listings_history table (triggers on properties + properties_extension) + one-shot
backfill from property_details.listing_events for pre-trigger history.
Tax reassessment forecast MI · Partial reset (capped growth)
- Current annual tax
- $1,125 · $94/mo
- Projected year-2 tax
- $1,216 · $101/mo
- Expected delta
- +$91/yr (+$8/mo · 8.1%)
ⓘ Screening estimate from a state-policy table — verify with the county assessor before closing.
Climate risk First Street
- Flood 1/10 Low FEMA zone X (unshaded) · 0% chance over 30 yrs
- Wildfire 1/10 Low
- Heat 3/10 Moderate 7 d/yr ≥98°F today · 14 d/yr by 30 yrs out
- Wind 1/10 Low
- Air quality 2/10 Low 1 unhealthy d/yr today · 2 by 30 yrs out
Nearby sold comps map
Loading sold comps map…
Walkable amenities ~0.75 mi
Loading nearby amenities…
Taxation est. · year 1
- Rental income
- $11,947
- − Mortgage interest
- −$4,756
- − Property taxes
- −$1,125
- − Insurance
- −$424
- − Repairs & maintenance
- −$956
- − Management
- −$956
- − Depreciation
- −$2,470
- Taxable income
- $1,260
- Est. tax owed @ 24.0%
- −$302
- After-tax cash flow
- $2,243/yr
For passive investors: Depreciation is non-cash, so a rental often shows a tax loss while cash-flowing — sheltering income. Rental losses are passive: they offset passive income freely, and up to $25,000/yr can offset ordinary (W-2) income if you actively participate and your MAGI is under $100k (phasing out to $0 by $150k); unused losses carry forward. On sale, claimed depreciation is recaptured at up to 25%, and gains may owe capital-gains tax (a 1031 exchange can defer both). Figures are a year-1 estimate at your 24.0% rate — not tax advice; consult a CPA.
Schools (NCES district)
- District
- Mt. Pleasant City School District
- NCES district ID
- 2624750
- Math proficiency
- 33% ▼ -5.00%
- Reading proficiency
- 48% ▼ -3.00%
- Median HH income
- $32,344
- Composite
- 33.16/100
- National rank
- #5548
- State rank
- #229 of 540 in MI
Livability — Mount Pleasant
- Score
- 82/100
- State rank
- #55
- US rank
- #1063
Category grades
Schools grade is shown separately in the Schools card above.
Census & demographics
- Census place
- Mount Pleasant, MI
- County
- Isabella County · 42,226 people
- City population
- 42,226
- Metro
- Mount Pleasant, MI
- Population (ZIP)
- 42,226
- Household income
- $51,267
- Rent vs Own
- Severe rent burden
- 2381.0
Population outlook (Isabella County) Hauer SSP2
- Today (2025)
- 75,111 people
- By 2030
- 77,600 · +3.3%
- By 2040
- 79,890 · +6.4%
- By 2050
- 81,568 · +8.6%
- By 2075
- 86,602 · +15.3%
- By 2100
- 92,201 · +22.8%
Race, ethnicity, and origin ACS 2023
- Neighborhood character
- Predominantly White (81%)
- Race & ethnicity
- White 81% Two or more races 6% Hispanic / Latino 5% Native American 4% Black 3% Asian 2%
- Hispanic origin (detail)
- Mexican 3%
- Common ancestry
- Romanian 6% Slovak 3% Iranian 3%
- Foreign-born
- 4% · Canada
- Languages at home
- 94% English-only · Spanish 2% Other Indo-European 1% German/W. Germanic 0%
Political lean MEDSL · Isabella
- 2024 margin
- Lean R (+7.5) · D 45.5% · R 53.0% · Other 1.6%
- 2008→2024 swing
- -26.7pp toward R · 2008: 19.2pp · 2024: -7.5pp
- All cycles
- 2024: R+7.5 2020: R+2.5 2016: R+3.7 2012: D+9.3 2008: D+19.2
Not yet ingested
- Civics
- —
Market trends
- HPI YoY
- ▼ -96.75%
- Current HPI
- 206.1153
- Rent YoY
- ▲ 16.89%
- Metro
- Mount Pleasant, MI
- State GDP YoY
- ▲ 1.37%
- F500 in state
- 28
Industry mix (Fortune 500 HQ in MI)
| Industry | F500 HQs | Revenue |
|---|---|---|
| Automotive Parts | 3 | $48B |
|
||
| Automotive | 2 | $372B |
|
||
| Chemicals | 1 | $45B |
|
||
| Automotive Retail | 1 | $29B |
|
||
| Healthcare / Medical Devices | 1 | $23B |
|
||
| Automotive Technology | 1 | $20B |
|
||
Price history
+0.0% since first listed2 events — show timeline
- 2026-02-18 Listed $84,900 MiRealSource-MiMLS
- 2026-02-18 Listed $84,900 REALCOMP
Property tax history
-2.0%/yrLatest (2023): $1,125 · +327.8% YoY. Source: county tax records.
Cash-flow waterfall
monthlySold comps — $/sqft
last 12 mo · ≤1 miLoading sold comps…