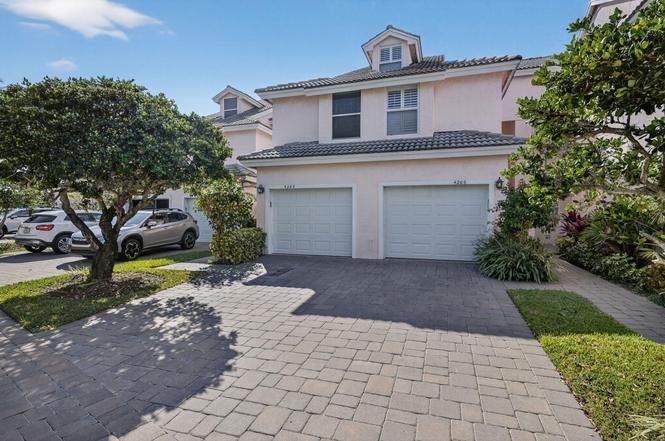
4205 Fairway Dr N #4205
Jupiter, FL 33477
$649,000D
2 bd · 2.5 ba ·
1,195 sqft ·
Built 1990
· SingleFamily
· Active
· 135 DOM
Cashflow @ list (25.0% down · 7.5%)
Estimated rent
$5,500/mo
Mortgage (P&I)
−$3,403
Tax + insurance
−$1,082
HOA
−$914
Vac / Maint / Mgmt
−$1,155
Net cashflow
$-1,054/mo
Annual
$-12,653/yr
Cap rate
4.34%
Cash-on-cash
-6.96%
DSCR
0.69
1% rule
0.85%
Cash to close
$181,720
Investor read
- This is a 2-bed/2.5-bath single-family listed at $649k.
- At list price, monthly cash flow is $-1k ($-13k/yr) — negative.
- To cash-flow at today's rent, offer at most $496k (23.5% below list).
- To meet the 1% rule (rent ≥ 1% of price), the offer needs to be $550k (15.3% below list).
- It's been on market 135 days — a 12% lower offer ($571k) is reasonable based on typical stale-listing flexibility.
- Recommended offer: $496k (23.5% below list) — sets the bar for cash-flow.
- In year one you build about $23k of equity ($4k loan paydown + $19k appreciation (2.9% local appreciation)).
- Location reads 70/100 on livability (#415 in FL) — a middle-class / working-renter tenant base. Strengths: crime A+, employment A+, housing A+; Watch: amenities F, commute F, cost of living F.
- Palm Beach (suburban): math 46% / reading 53% proficiency, ranked #34 of 73 in FL (top 47%) — families likely to look elsewhere, expect single-tenant / working-renter base with shorter leases.
- Market conditions: Rents rising fast (+10.3%/yr); 337 active listings in the ZIP; 40 comparable units currently listed for rent nearby; rentals at typical pace (median 24d on market — plan ~3-4 weeks tenant-placement turnaround); solid renter incomes; 3,974 units permitted in Palm Beach County in 2024 (1,012 in 5+ unit buildings).
- Palm Beach County population projected at +30% by 2050 — long-run rental-demand tailwind backs the buy-and-hold thesis.
- 5 sale attempts since 2y ago; this cycle's ask is 9444% above the opening price — seller raised mid-cycle; expect resistance to lowballs.
- By year 2, paydown + projected appreciation supports a ~$38k cash-out refi (75% LTV) — recoverable capital for the next deal without selling this one.
- Climate carrying-cost: major flood risk; severe wind risk, 99% chance of damaging wind over 30y; extreme-heat days projected 7→22/yr by 2055 (HVAC capex compounding) — expect insurance premiums to compound above CPI over the hold.
- Cap rate 4.3% vs local median 2.6% in Jupiter — top-decile yield for the area; either an underpriced asset or a hidden risk that comps aren't pricing in. Stress-test before assuming the spread holds.
- At $5,500/mo this rent would consume 63% of the median local household income ($105k/yr) (locally 445% of renters already pay >50% of income on rent) — very limited rent-growth headroom before tenants either downsize or default.
Questions for listing agent
- What do current leases actually rent for vs. the listed asking? Can we see a recent rent roll and the last 12 months of T-12 income?
- It's been on market 135 days. Have you received any prior offers? Is the seller open to a 24% concession, seller financing, or rate buy-down credit?
- What does the HOA fee cover, when was the last increase, and are there any pending special assessments or reserve-fund shortfalls?
- Why hasn't it sold? Are there any deal-killer items the seller is aware of (foundation, flood, title, zoning, code violations)?
- Is there a deadline driving the sale (1031 exchange, divorce, estate, relocation)? That informs how much negotiation room exists.
- Schools are A-rated — typically a magnet for longer-tenancy family renters. What's the average tenant stay here, and is there a school-zone premium baked into asking?
- The area grade is low — what's the realistic commute time and amenity access for the typical tenant pool here? Any planned neighborhood developments (good or bad) we should know about?
- What's the average days-on-market for RENTAL listings here right now (not sales)? A rising rental-DOM trend means longer vacancies and softer asking-rent achievability than the comps imply.
CashFlowRE · CFR-W51CT9BF14AWZ2
· Data 2 days ago
cashflowre.app · 2026-05-29