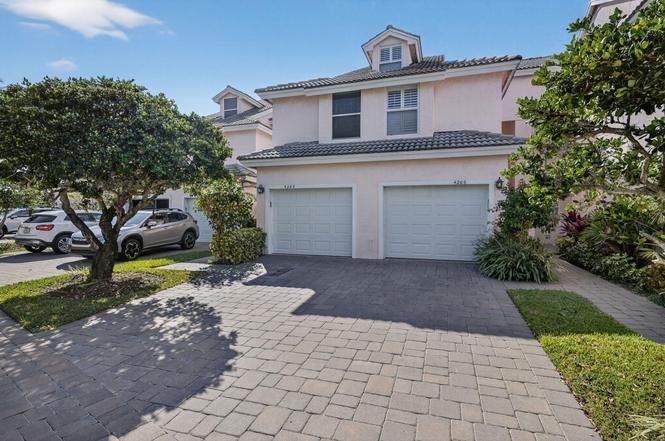
4205 Fairway Dr N #4205 · Jupiter, FL
Flood risk 6/10 · Moderate
- FEMA flood zone
- X (unshaded)
- Chance of flooding over 30 yrs
- 0.71%
- Est. flood insurance / yr
- $507 – $1,088
Fire risk 1/10 · Minimal
- Est. fire insurance / yr
- $947 – $1,759
Heat risk 9/10 · Severe
- Hot days now (above 106°F)
- 7 days/yr
- Hot days in 30 yrs
- 22 days/yr
Wind risk 10/10 · Severe
- Chance of severe wind over 30 yrs
- 99.0%
Air-quality risk 2/10 · Minimal
- Unhealthy air days now
- 1 days/yr
- Unhealthy air days in 30 yrs
- 2 days/yr
Risk factors via First Street. Map © Google.
Why this score? — see what drove the D grade
The composite is a weighted blend of 9 inputs, each scored 0–100. Each bar is that input's sub-score; the figure is the points it added to the 100-point composite (weight × sub-score).
- ARV discount +7.5/15.0
- Cash flow +6.6/30.0
- Appreciation +6.5/10.0
- Rent growth +5.0/5.0
- Schools +4.3/10.0
- 1% rule +3.5/10.0
- Livability +3.5/5.0
- Condition / age +2.5/5.0
- DSCR +0.9/10.0
$649,000
🖨 Deal sheet 📄 Offer letter ✓ Due diligence
Listing remarks
2 bedroom / 2.5 bath w/ primary bedroom on main floor. This home offers the ideal combination of comfort and convenience. A short distance to pristine Jupiter beaches, making it perfect for beach lovers. Views of the back 9 of Jupiter Dunes par 3 golf course. This home is the perfect retreat for those looking to relax and / or be active. Close to fine waterfront dining, water sports, deep sea fishing, shopping, the Maltz theatre or the Cinepolis Luxury Cinemas. This home offers the perfect home base to experience the best of Jupiter's coastal living lifestyle Estuary community offers a pool /spa / clubhouse. This home faces the 11th fairway of the Jupiter Dunes Par3 golf course. 1 block to
Key facts
- Pool spa clubhouse
- $914 HOA
- Garage
Tags
Property features AI
Finance
- Financial info: Pets allowed (restrictions possible)
- HOA & community: Community amenities include clubhouse, pool, and street lights; HOA fee $914 monthly (includes cable TV, security, common areas, and common real estate tax)
Exterior
- Parking: Attached garage (1 covered space, 1 garage space)
- Security: Smoke detectors; Gated community (no guard)
- Utilities: Public water; Public sewer; Three phase electric; Cable available
- Home design: Condominium; Two stories; Faces East; Resale property
- Construction: Stucco and CBS construction
- Exterior features: Covered patio; Screened patio; Patio
Interior
- Kitchen: Dishwasher; Electric range; Microwave; Refrigerator
- Bedrooms: One bedroom on the main level
- Flooring: Ceramic tile; Wood
- Bathrooms: 2 full bathrooms, 1 half bathroom (3 total)
- Heating & cooling: Central individual heating; Central individual cooling
- Interior features: Walk-in closets; Split bedroom layout; Blinds
- Laundry & utility: Laundry located in garage; Electric water heater
Neighborhood map
What this means for you Summary
Snapshot
- This is a 2-bed/2.5-bath single-family listed at $649k.
Deal economics
- At list price, monthly cash flow is $-1k ($-13k/yr) — negative.
- To cash-flow at today's rent, offer at most $496k (23.5% below list).
- To meet the 1% rule (rent ≥ 1% of price), the offer needs to be $550k (15.3% below list).
- Recommended offer: $496k (23.5% below list) — sets the bar for cash-flow.
- Cap rate 4.3% vs local median 2.6% in Jupiter — top-decile yield for the area; either an underpriced asset or a hidden risk that comps aren't pricing in. Stress-test before assuming the spread holds.
Location & tenants
- Location reads 70/100 on livability (#415 in FL) — a middle-class / working-renter tenant base. Strengths: crime A+, employment A+, housing A+; Watch: amenities F, commute F, cost of living F.
- Palm Beach (suburban): math 46% / reading 53% proficiency, ranked #34 of 73 in FL (top 47%) — families likely to look elsewhere, expect single-tenant / working-renter base with shorter leases.
- Market conditions: Rents rising fast (+10.3%/yr); 337 active listings in the ZIP; 40 comparable units currently listed for rent nearby; rentals at typical pace (median 24d on market — plan ~3-4 weeks tenant-placement turnaround); solid renter incomes; 3,974 units permitted in Palm Beach County in 2024 (1,012 in 5+ unit buildings).
- At $5,500/mo this rent would consume 63% of the median local household income ($105k/yr) (locally 445% of renters already pay >50% of income on rent) — very limited rent-growth headroom before tenants either downsize or default.
Forward outlook
- In year one you build about $23k of equity ($4k loan paydown + $19k appreciation (2.9% local appreciation)).
- Palm Beach County population projected at +30% by 2050 — long-run rental-demand tailwind backs the buy-and-hold thesis.
- By year 2, paydown + projected appreciation supports a ~$38k cash-out refi (75% LTV) — recoverable capital for the next deal without selling this one.
Negotiation context
- It's been on market 135 days — a 12% lower offer ($571k) is reasonable based on typical stale-listing flexibility.
- 5 sale attempts since 2y ago; this cycle's ask is 9444% above the opening price — seller raised mid-cycle; expect resistance to lowballs.
Risks & watch-outs
- Climate carrying-cost: major flood risk; severe wind risk, 99% chance of damaging wind over 30y; extreme-heat days projected 7→22/yr by 2055 (HVAC capex compounding) — expect insurance premiums to compound above CPI over the hold.
Questions for the listing agent
- What do current leases actually rent for vs. the listed asking? Can we see a recent rent roll and the last 12 months of T-12 income?
- It's been on market 135 days. Have you received any prior offers? Is the seller open to a 24% concession, seller financing, or rate buy-down credit?
- What does the HOA fee cover, when was the last increase, and are there any pending special assessments or reserve-fund shortfalls?
- Why hasn't it sold? Are there any deal-killer items the seller is aware of (foundation, flood, title, zoning, code violations)?
- Is there a deadline driving the sale (1031 exchange, divorce, estate, relocation)? That informs how much negotiation room exists.
- Schools are A-rated — typically a magnet for longer-tenancy family renters. What's the average tenant stay here, and is there a school-zone premium baked into asking?
- The area grade is low — what's the realistic commute time and amenity access for the typical tenant pool here? Any planned neighborhood developments (good or bad) we should know about?
- What's the average days-on-market for RENTAL listings here right now (not sales)? A rising rental-DOM trend means longer vacancies and softer asking-rent achievability than the comps imply.
- What's the recent tenant-quality profile in this submarket — average credit score on applications, eviction rate, late-payment / NSF rate, and stable-employment percentage? A property-management company in the area should have these aggregated.
- How much new for-sale + rental construction is in the pipeline within 1–3 miles? Heavy new supply typically softens prices + rents 12–24 months out; constrained supply supports both.
Investment metrics
- 1% rule
- 0.85% ✗
- Cap rate
- 4.34%
- Cash-on-cash
- -6.96%
- DSCR
- 0.69
- GRM
- 9.8
CMA / ARV
No comps found within radius.
Projected returns pro-forma
2.93% appreciation · 8.0% rent growth · sell at horizon
- IRR
- 3.6%
- Equity multiple
- 1.21×
- Total profit
- $38,277
- Equity at exit
- $289,203
- IRR
- 9.6%
- Equity multiple
- 2.59×
- Total profit
- $288,552
- Equity at exit
- $443,675
Cash invested: $181,720 (down + closing). Projections, not guarantees.
Landlord ↔ Tenant lean methodology
- Overall (STATE)
- 87 Strongly Landlord-Friendly
- State Florida
- 87 Strongly Landlord-Friendly · R+3
- County
- — inherits STATE
- City
- — inherits STATE
ZIP-level market 33477
- Home prices YoY
- 0.8%
- Rents YoY
- 10.3%
- Active inventory
- 337
- Price-to-rent
- 9.8×
Monthly cashflow live
- Estimated rent
- $5,500 high interval (Pro) →
- Mortgage (P&I)
- −$3,403
- Tax est. 1.5%
- −$811 /mo · $9,735/yr
- Insurance
- −$270
- HOA
- −$914
- Vacancy / Maint / Mgmt
- −$1,155
- Net cashflow
- $-1,054
Break-even live
UW: 25.0% down · 7.5% · 30yr · 1.5% tax · 5.0% vac · 8.0% maint · 8.0% mgmt
Financing live
Cash to close
- Down payment
- $162,250
- Closing costs
- $19,470
- Reserves months
- —
- Total cash needed
- —
Loan-product check · same deal, 3 products live
Conventional
25% down · 7.5% · 30yr
- Down + closing
- —
- Monthly P&I
- —
- Monthly cashflow
- —
- DSCR
- —
- Eligible?
- —
Personal DTI + credit; lowest rate.
DSCR
20% down · 8.5% · 30yr
- Down + closing
- —
- Monthly P&I
- —
- Monthly cashflow
- —
- DSCR
- —
- Eligible?
- —
No personal income docs; deal must DSCR.
Hard money
10% down · 12.0% · 12mo
- Down + closing
- —
- Monthly P&I
- —
- Monthly cashflow
- —
- DSCR
- —
- Eligible?
- —
Short-term bridge; refi at stabilization.
Rent comps 40 comps
| Address | Beds | Baths | Sqft | Rent | $/sqft | DOM | Units | Dist |
|---|---|---|---|---|---|---|---|---|
| 2707 Fairway Dr N Jupiter, FL | 2.0 | 2.5 | 1195 | $2,800 | $2.34 | 24d | 1 | 0.01mi |
| 2905 Fairway Dr N Jupiter, FL | 2.0 | 2.5 | 1195 | $7,500 | $6.28 | 24d | 1 | 0.01mi |
| 2403 Fairway Dr N Jupiter, FL | 2.0 | 2.5 | 1195 | $4,000 | $3.35 | 24d | 1 | 0.01mi |
| 4105 Fairway Dr N Jupiter, FL | 2.0 | 2.5 | 1195 | $6,500 | $5.44 | 24d | 1 | 0.01mi |
| 2604 Fairway Dr N Jupiter, FL | 2.0 | 2.0 | 1346 | $3,500 | $2.60 | 4d | 1 | 0.01mi |
| 3108 Fairway Dr N Jupiter, FL | 2.0 | 2.0 | 1346 | $7,000 | $5.20 | 24d | 1 | 0.01mi |
| 3602 Fairway Dr N Jupiter, FL | 2.0 | 2.0 | 1346 | $3,700 | $2.75 | 24d | 1 | 0.01mi |
| 4409 Fairway Dr S Jupiter, FL | 2.0 | 2.5 | 1195 | $7,500 | $6.28 | 24d | 1 | 0.02mi |
| 404 Clubhouse Cir Jupiter, FL | 2.0 | 2.0 | 1280 | $3,500 | $2.73 | 15d | 1 | 0.15mi |
| 404 Clubhouse Cir Jupiter, FL | 2.0 | 2.0 | 1280 | $7,500 | $5.86 | 24d | 1 | 0.15mi |
| 803 Clubhouse Cir Jupiter, FL | 2.0 | 2.0 | 1280 | $2,500 | $1.95 | 24d | 1 | 0.22mi |
| 400 Ocean Trail Way #401 Jupiter, FL | 2.0 | 2.0 | 1270 | $11,000 | $8.66 | 24d | 1 | 0.27mi |
| 400 Ocean Trail Way #401 Jupiter, FL | 2.0 | 2.0 | 1270 | $11,000 | $8.66 | 10d | 1 | 0.27mi |
| 400 Ocean Trail Way #804 Jupiter, FL | 2.0 | 2.0 | 1170 | $2,950 | $2.52 | 24d | 1 | 0.27mi |
| 400 Ocean Trail Way #101 Jupiter, FL | 2.0 | 2.0 | 1270 | $4,500 | $3.54 | 24d | 1 | 0.27mi |
| 400 Ocean Trail Way #707 Jupiter, FL | 2.0 | 2.0 | 1170 | $8,500 | $7.26 | 24d | 1 | 0.27mi |
| 400 Ocean Trail Way #804 Jupiter, FL | 2.0 | 2.0 | 1170 | $2,950 | $2.52 | 22d | 1 | 0.27mi |
| 755 Saturn St Jupiter, FL | 2.0 | 2.0 | 1063 | $4,250 | $4.00 | 17d | 2 | 0.32mi |
| 300 Ocean Trail Way #702 Jupiter, FL | 3.0 | 2.0 | 1170 | $13,000 | $11.11 | 24d | 1 | 0.33mi |
| 300 Ocean Trail Way #510 Jupiter, FL | 2.0 | 2.0 | 1270 | $8,500 | $6.69 | 14d | 1 | 0.33mi |
| 300 Ocean Trail Way #903 Jupiter, FL | 2.0 | 2.0 | 1170 | $6,000 | $5.13 | 19d | 1 | 0.33mi |
| 300 Ocean Trail Way #410 Jupiter, FL | 2.0 | 2.0 | 1270 | $4,500 | $3.54 | 5d | 1 | 0.33mi |
| 300 Ocean Trail Way #907 Jupiter, FL | 2.0 | 2.0 | 1170 | $5,500 | $4.70 | 24d | 1 | 0.33mi |
| 300 Ocean Trail Way #602 Jupiter, FL | 2.0 | 2.0 | 1170 | $3,500 | $2.99 | 24d | 1 | 0.33mi |
| 300 Ocean Trail Way #308 Jupiter, FL | 2.0 | 2.0 | 1170 | $3,800 | $3.25 | 17d | 1 | 0.33mi |
| 300 Ocean Trail Way #702 Jupiter, FL | 3.0 | 2.0 | 1170 | $13,000 | $11.11 | 10d | 1 | 0.33mi |
| 300 Ocean Trail Way #607 Jupiter, FL | 2.0 | 2.0 | 1170 | $9,500 | $8.12 | 24d | 1 | 0.33mi |
| 300 Ocean Trail Way #1202 Jupiter, FL | 2.0 | 2.0 | 1170 | $4,500 | $3.85 | 24d | 1 | 0.33mi |
| 300 Ocean Trail Way #403 Jupiter, FL | 2.0 | 2.0 | 1170 | $3,450 | $2.95 | 17d | 1 | 0.33mi |
| 200 Ocean Trail Way #407 Jupiter, FL | 2.0 | 2.0 | 1170 | $8,500 | $7.26 | 22d | 1 | 0.37mi |
| 200 Ocean Trail Way #609 Jupiter, FL | 2.0 | 2.0 | 1170 | $9,500 | $8.12 | 10d | 1 | 0.37mi |
| 200 Ocean Trail Way #1108 Jupiter, FL | 2.0 | 2.0 | 1170 | $10,000 | $8.55 | 10d | 1 | 0.37mi |
| 200 Ocean Trail Way #1105 Jupiter, FL | 2.0 | 2.0 | 1170 | $4,100 | $3.50 | 24d | 1 | 0.37mi |
| 200 Ocean Trail Way #609 Jupiter, FL | 2.0 | 2.0 | 1170 | $9,500 | $8.12 | 24d | 1 | 0.37mi |
| 200 Ocean Trail Way #1108 Jupiter, FL | 2.0 | 2.0 | 1170 | $10,000 | $8.55 | 19d | 1 | 0.37mi |
| 200 Ocean Trail Way #1107 Jupiter, FL | 2.0 | 2.0 | 1170 | $4,250 | $3.63 | 24d | 1 | 0.37mi |
| 500 Ocean Trail Way Jupiter, FL | 2.0 | 2.0 | 1523 | $6,150 | $4.04 | 24d | 1 | 0.43mi |
| 100 Ocean Trail Way Jupiter, FL | 2.0 | 2.0 | 1170 | $4,000 | $3.42 | 24d | 1 | 0.44mi |
| 100 Ocean Trail Way #609 Jupiter, FL | 2.0 | 2.0 | 1170 | $8,500 | $7.26 | 24d | 1 | 0.44mi |
| 131 Palm Ave #36 Jupiter, FL | 2.0 | 2.0 | 1321 | $3,700 | $2.80 | 24d | 1 | 0.50mi |
HOA detail
- Monthly dues
- $914 · $10,968/yr
- Likely covers
- waterpool
Listing history 21 events
-
2026-06-18days on market $649,000 Active 135 DOM
-
2026-06-17days on market $649,000 Active 134 DOM
-
2026-06-16days on market $649,000 Active 133 DOM
-
2026-06-15days on market $649,000 Active 132 DOM
-
2026-06-13days on market $649,000 Active 130 DOM
-
2026-06-09days on market $649,000 Active 126 DOM
-
2026-06-07days on market $649,000 Active 124 DOM
-
2026-06-04days on market $649,000 Active 121 DOM
-
2026-06-03days on market $649,000 Active 120 DOM
-
2026-06-01days on market $649,000 Active 118 DOM
-
2026-05-31days on market $649,000 Active 117 DOM
-
2026-05-17historical $6,800
-
2026-04-15price $649,000
-
2026-04-09$6,800
-
2026-04-09historical $6,800
-
2026-02-03$675,000 Active
-
2026-01-21$6,800
-
2025-12-02historical $7,000
-
2025-07-06$7,000
-
2025-06-26historical $7,000
-
2024-12-03$7,000
ⓘ Source: listings_history table (triggers on properties + properties_extension) + one-shot
backfill from property_details.listing_events for pre-trigger history.
Climate risk First Street
- Flood 6/10 Major FEMA zone X (unshaded) · 71% chance over 30 yrs
- Wildfire 1/10 Low
- Heat 9/10 Extreme 7 d/yr ≥106°F today · 22 d/yr by 30 yrs out
- Wind 10/10 Extreme 99% chance of damaging wind over 30 yrs
- Air quality 2/10 Low 1 unhealthy d/yr today · 2 by 30 yrs out
Nearby sold comps map
Loading sold comps map…
Walkable amenities ~0.75 mi
Loading nearby amenities…
Taxation est. · year 1
- Rental income
- $65,995
- − Mortgage interest
- −$36,354
- − Property taxes
- −$9,735
- − Insurance
- −$3,245
- − Repairs & maintenance
- −$5,280
- − Management
- −$5,280
- − HOA
- −$10,968
- − Depreciation
- −$18,880
- Taxable loss
- −$23,746
- Est. tax savings @ 24.0%
- +$5,699
- After-tax cash flow
- $-6,954/yr
For passive investors: Depreciation is non-cash, so a rental often shows a tax loss while cash-flowing — sheltering income. Rental losses are passive: they offset passive income freely, and up to $25,000/yr can offset ordinary (W-2) income if you actively participate and your MAGI is under $100k (phasing out to $0 by $150k); unused losses carry forward. On sale, claimed depreciation is recaptured at up to 25%, and gains may owe capital-gains tax (a 1031 exchange can defer both). Figures are a year-1 estimate at your 24.0% rate — not tax advice; consult a CPA.
Schools (NCES district)
- District
- Palm Beach
- NCES district ID
- 1201500
- Math proficiency
- 46% ▼ -16.00%
- Reading proficiency
- 53% ▼ -4.00%
- Median HH income
- $53,943
- Composite
- 42.72/100
- National rank
- #3160
- State rank
- #34 of 73 in FL
Livability — Jupiter
- Score
- 70/100
- State rank
- #415
- US rank
- #7386
Category grades
Schools grade is shown separately in the Schools card above.
Census & demographics
- Census place
- Jupiter, FL
- County
- Palm Beach County · 1,438,312 people
- City population
- 68,420
- Metro
- Miami-Fort Lauderdale-Pompano Beach, FL
- Population (ZIP)
- 12,908
- Household income
- $104,992
- Rent vs Own
- Severe rent burden
- 445.0
Population outlook (Palm Beach County) Hauer SSP2
- Today (2025)
- 1,637,487 people
- By 2030
- 1,743,255 · +6.5%
- By 2040
- 1,948,712 · +19.0%
- By 2050
- 2,132,979 · +30.3%
- By 2075
- 2,530,027 · +54.5%
- By 2100
- 2,706,979 · +65.3%
Race, ethnicity, and origin ACS 2023
- Neighborhood character
- Predominantly White (93%)
- Race & ethnicity
- White 93% Hispanic / Latino 5% Two or more races 4%
- Hispanic origin (detail)
- Common ancestry
- Romanian 6% Scotch-Irish 4% Lithuanian 2%
- Foreign-born
- 10% · Canada, Guatemala, Jamaica
- Languages at home
- 90% English-only · Spanish 5% Other Indo-European 2% German/W. Germanic 1%
Political lean MEDSL · Palm Beach
- 2024 margin
- Toss-up / Even · D 50.0% · R 49.2%
- 2008→2024 swing
- -22.1pp toward R · 2008: 22.9pp · 2024: 0.8pp
- All cycles
- 2024: D+0.8 2020: D+12.8 2016: D+15.3 2012: D+17.0 2008: D+22.9
Not yet ingested
- Civics
- —
Market trends
- HPI YoY
- ▲ 2.93%
- Current HPI
- 356.212
- Rent YoY
- ▲ 10.27%
- Metro
- Miami-Fort Lauderdale-Pompano Beach, FL
- State GDP YoY
- ▲ 3.28%
- F500 in state
- 36
Industry mix (Fortune 500 HQ in FL)
| Industry | F500 HQs | Revenue |
|---|---|---|
| Industrial Technology | 2 | $29B |
|
||
| Insurance | 2 | $17B |
|
||
| Retail | 1 | $60B |
|
||
| Technology Distribution | 1 | $58B |
|
||
| Homebuilding | 1 | $35B |
|
||
| Technology Manufacturing | 1 | $35B |
|
||
Price history
-2.9% since first listed10 events — show timeline
- 2026-05-17 Rental Removed $6,800 RMLSFL
- 2026-04-15 Price Changed $649,000 Beaches MLS
- 2026-04-09 Listed for Rent $6,800 RMLSFL
- 2026-04-09 Rental Removed $6,800 GFLMLS
- 2026-02-03 Listed $675,000 Beaches MLS
- 2026-01-21 Listed for Rent $6,800 GFLMLS
- 2025-12-02 Rental Removed $7,000 RMLSFL
- 2025-07-06 Listed for Rent $7,000 RMLSFL
- 2025-06-26 Rental Removed $7,000 RMLSFL
- 2024-12-03 Listed for Rent $7,000 RMLSFL
Cash-flow waterfall
monthlySold comps — $/sqft
last 12 mo · ≤1 miLoading sold comps…