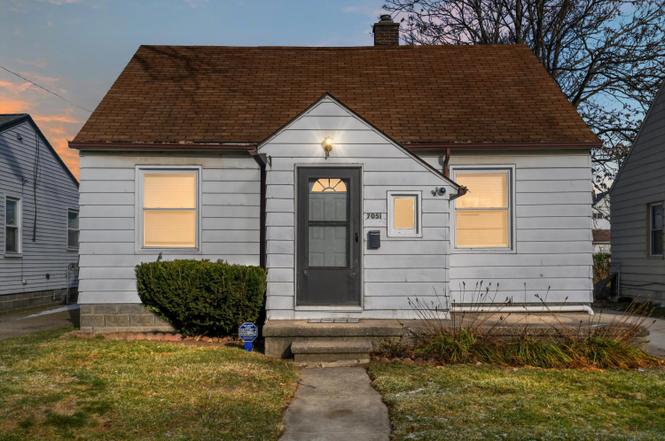
7051 Hupp Ave
Warren, MI 48091
$114,000C
3 bd · 1.0 ba ·
885 sqft ·
Built 1946
· SingleFamily
· Pending
· 6 DOM
Cashflow @ list (25.0% down · 7.5%)
Estimated rent
$1,358/mo
Mortgage (P&I)
−$598
Tax + insurance
−$176
HOA
−$0
Vac / Maint / Mgmt
−$285
Net cashflow
$299/mo
Annual
$3,591/yr
Cap rate
9.44%
Cash-on-cash
11.25%
DSCR
1.50
1% rule
1.19%
Cash to close
$31,920
Investor read
- This is a 3-bed/1.0-bath single-family listed at $114k.
- At list price, monthly cash flow is $299 ($4k/yr) — positive.
- The deal already cash-flows at list — no discount required.
- Meets the 1% rule at list price ($1k rent vs $114k).
- Only 6 days on market — expect competitive offers; lowballing is unlikely to land.
- Local home prices are declining (-3.0%/yr); year-one equity from $788 of loan paydown is wiped out by about $3k of value loss. Plan a longer hold.
- Location reads 74/100 on livability (#171 in MI, #4,491 nationally) — a middle-class / working-renter tenant base. Strengths: commute A+, cost of living A+, housing A+; Watch: amenities D, employment D, crime D-.
- Center Line Public Schools (suburban): math 14% / reading 29% proficiency, ranked #459 of 540 in MI (top 85%) — low school quality limits family demand, transient renter base, plan for 1-2y turnover; 60% free/reduced lunch — lower-income household profile, screen leases tightly.
- Zoned schools: Mark C Roose Elementary School (math 17% / reading 22%, grade F, #1,110 of 1,397 statewide, top 81%, 489 students, 84% FRL); Wolfe Middle School (math 13% / reading 31%, grade F, #408 of 493 statewide, top 84%, 500 students, 72% FRL); Center Line High School (math 12% / reading 37%, grade F, #481 of 713 statewide, top 81%, 663 students, 67% FRL).
- Watch-outs: built in 1946 — expect roof / HVAC / electrical / plumbing capex.
- Market conditions: Rents rising (+2.4%/yr); 170 active listings in the ZIP; 40 comparable units currently listed for rent nearby; rentals at typical pace (median 26d on market — plan ~3-4 weeks tenant-placement turnaround); 1,321 units permitted in Macomb County in 2024 (86 in 5+ unit buildings).
- Macomb County population projected at +9% by 2050 — modest demand growth; plan on rents tracking national, not racing it.
- 12 sale attempts since 24y ago with the ask held roughly flat each time — persistent listings suggest the price (not the market) is what's stuck; bring a comps-based counter.
- Cap rate 9.4% vs local median 5.2% in Warren — top-decile yield for the area; either an underpriced asset or a hidden risk that comps aren't pricing in. Stress-test before assuming the spread holds.
- This rent runs 30% of the median local income ($54k/yr) — at the standard rent-burdened threshold; future hikes will face affordability resistance.
Questions for listing agent
- Built in 1946 — when were the roof, HVAC, electrical panel, plumbing, and water heater last replaced?
- Is there a deadline driving the sale (1031 exchange, divorce, estate, relocation)? That informs how much negotiation room exists.
- Schools are D-rated, which usually means shorter tenancies and higher turnover. Who's the typical renter profile here, and what's been the actual vacancy rate?
- Crime grade is D in this area — have there been break-ins, vandalism, or insurance claims at this property in the last 3 years? What carrier currently insures it and at what premium?
- What's the average days-on-market for RENTAL listings here right now (not sales)? A rising rental-DOM trend means longer vacancies and softer asking-rent achievability than the comps imply.
- What's the recent tenant-quality profile in this submarket — average credit score on applications, eviction rate, late-payment / NSF rate, and stable-employment percentage? A property-management company in the area should have these aggregated.
- How much new for-sale + rental construction is in the pipeline within 1–3 miles? Heavy new supply typically softens prices + rents 12–24 months out; constrained supply supports both.
CashFlowRE · CFR-W8NYY13XEXZ7KJ
· Data 4 weeks ago
cashflowre.app · 2026-05-29