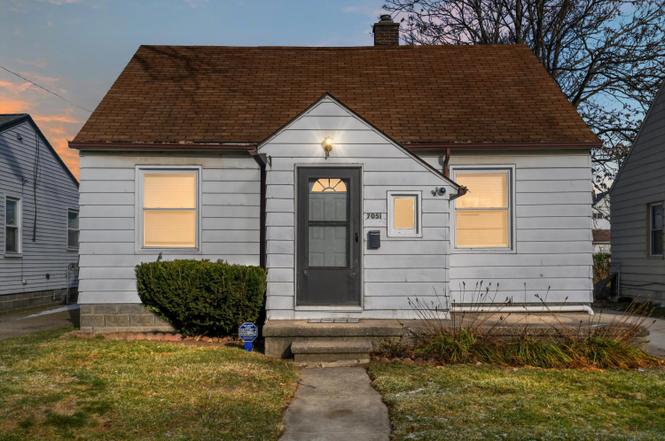
7051 Hupp Ave · Warren, MI
Flood risk 1/10 · Minimal
- FEMA flood zone
- X (unshaded)
- Chance of flooding over 30 yrs
- 0.0%
- Est. flood insurance / yr
- $507 – $1,088
Fire risk 1/10 · Minimal
- Est. fire insurance / yr
- $784 – $1,456
Heat risk 3/10 · Minor
- Hot days now (above 97°F)
- 7 days/yr
- Hot days in 30 yrs
- 15 days/yr
Wind risk 1/10 · Minimal
- Chance of severe wind over 30 yrs
- —
Air-quality risk 3/10 · Minor
- Unhealthy air days now
- 3 days/yr
- Unhealthy air days in 30 yrs
- 4 days/yr
Risk factors via First Street. Map © Google.
Why this score? — see what drove the C grade
The composite is a weighted blend of 9 inputs, each scored 0–100. Each bar is that input's sub-score; the figure is the points it added to the 100-point composite (weight × sub-score).
- Cash flow +26.4/30.0
- DSCR +9.0/10.0
- 1% rule +6.9/10.0
- ARV discount +3.8/15.0
- Livability +3.7/5.0
- Rent growth +3.1/5.0
- Condition / age +2.5/5.0
- Schools +1.8/10.0
- Appreciation +0.0/10.0
$114,000
🖨 Deal sheet (PDF) 📄 Offer letter ✓ Due diligence
Listing remarks MLS
Move-in condition home that is affordably priced. Freshly painted interior, new flooring, newer furnace, vinyl windows, concrete driveway, basement for storage and more.
Key facts
- Vinyl windows
- Newer furnace
- New flooring
Tags
Neighborhood map
What this means for you Summary
Snapshot
- This is a 3-bed/1.0-bath single-family listed at $114k.
Deal economics
- At list price, monthly cash flow is $299 ($4k/yr) — positive.
- The deal already cash-flows at list — no discount required.
- Meets the 1% rule at list price ($1k rent vs $114k).
- Cap rate 9.4% vs local median 5.2% in Warren — top-decile yield for the area; either an underpriced asset or a hidden risk that comps aren't pricing in. Stress-test before assuming the spread holds.
Location & tenants
- Location reads 74/100 on livability (#171 in MI, #4,491 nationally) — a middle-class / working-renter tenant base. Strengths: commute A+, cost of living A+, housing A+; Watch: amenities D, employment D, crime D-.
- Center Line Public Schools (suburban): math 14% / reading 29% proficiency, ranked #459 of 540 in MI (top 85%) — low school quality limits family demand, transient renter base, plan for 1-2y turnover; 60% free/reduced lunch — lower-income household profile, screen leases tightly.
- Zoned schools: Mark C Roose Elementary School (math 17% / reading 22%, grade F, #1,110 of 1,397 statewide, top 81%, 489 students, 84% FRL); Wolfe Middle School (math 13% / reading 31%, grade F, #408 of 493 statewide, top 84%, 500 students, 72% FRL); Center Line High School (math 12% / reading 37%, grade F, #481 of 713 statewide, top 81%, 663 students, 67% FRL).
- Market conditions: Rents rising (+2.4%/yr); 170 active listings in the ZIP; 40 comparable units currently listed for rent nearby; rentals at typical pace (median 26d on market — plan ~3-4 weeks tenant-placement turnaround); 1,321 units permitted in Macomb County in 2024 (86 in 5+ unit buildings).
- This rent runs 30% of the median local income ($54k/yr) — at the standard rent-burdened threshold; future hikes will face affordability resistance.
Forward outlook
- Local home prices are declining (-3.0%/yr); year-one equity from $788 of loan paydown is wiped out by about $3k of value loss. Plan a longer hold.
- Macomb County population projected at +9% by 2050 — modest demand growth; plan on rents tracking national, not racing it.
Negotiation context
- Only 6 days on market — expect competitive offers; lowballing is unlikely to land.
- 12 sale attempts since 24y ago with the ask held roughly flat each time — persistent listings suggest the price (not the market) is what's stuck; bring a comps-based counter.
Risks & watch-outs
- Watch-outs: built in 1946 — expect roof / HVAC / electrical / plumbing capex.
Questions for the listing agent
- Built in 1946 — when were the roof, HVAC, electrical panel, plumbing, and water heater last replaced?
- Is there a deadline driving the sale (1031 exchange, divorce, estate, relocation)? That informs how much negotiation room exists.
- Schools are D-rated, which usually means shorter tenancies and higher turnover. Who's the typical renter profile here, and what's been the actual vacancy rate?
- Crime grade is D in this area — have there been break-ins, vandalism, or insurance claims at this property in the last 3 years? What carrier currently insures it and at what premium?
- What's the average days-on-market for RENTAL listings here right now (not sales)? A rising rental-DOM trend means longer vacancies and softer asking-rent achievability than the comps imply.
- What's the recent tenant-quality profile in this submarket — average credit score on applications, eviction rate, late-payment / NSF rate, and stable-employment percentage? A property-management company in the area should have these aggregated.
- How much new for-sale + rental construction is in the pipeline within 1–3 miles? Heavy new supply typically softens prices + rents 12–24 months out; constrained supply supports both.
Investment metrics
- 1% rule
- 1.19% ✓
- Cap rate
- 9.44%
- Cash-on-cash
- 11.25%
- DSCR
- 1.50
- GRM
- 7.0
CMA / ARV
- ARV (on-the-fly)
- $105,315
- Comps found
- 12
Show comp detail 12 sales within ~0.75 mi
| Address | Dist | Beds/Ba | Sqft | Sold | Price | $/sf | Match |
|---|---|---|---|---|---|---|---|
| 7027 Chalmers Ave | 0.20mi | 3/1.0 | 900 (+2%) | 3mo | $79,000 | $88 | 85 |
| 8249 Packard Ave | 0.45mi | 3/1.0 | 871 (-2%) | 1mo | $68,000 | $78 | 75 |
| 8251 Hudson Ave | 0.46mi | 3/1.0 | 908 (+3%) | 4mo | $84,000 | $93 | 71 |
| 7535 Meadow Ave | 0.39mi | 3/1.5 | 935 (+6%) | 2mo | $125,000 | $134 | 68 |
| 6871 Lozier Ave | 0.46mi | 3/1.0 | 930 (+5%) | 2mo | $100,000 | $108 | 68 |
| 8285 Packard Ave | 0.49mi | 3/1.0 | 944 (+7%) | 3mo | $100,000 | $106 | 64 |
| 7592 Ready Ave | 0.62mi | 3/1.0 | 925 (+4%) | 4mo | $110,000 | $119 | 60 |
| 7003 Rivard Ave | 0.70mi | 3/1.0 | 955 (+8%) | 4mo | $102,000 | $107 | 51 |
| 8434 Orchard Ave | 0.66mi | 3/1.0 | 1,012 (+14%) | 1mo | $125,000 | $124 | 44 |
| 7643 Rivard Ave | 0.74mi | 3/1.0 | 980 (+11%) | 4mo | $124,900 | $127 | 44 |
| 8420 Republic Ave | 0.67mi | 3/1.0 | 1,015 (+15%) | 2mo | $150,000 | $148 | 42 |
| 7244 Fisher Ave | 0.63mi | 4/1.0 (+1) | 1,014 (+15%) | 3mo | $154,900 | $153 | 39 |
Match score weights: distance 35% · size 25% · config 20% · recency 20%. Top-matched comps best support the ARV.
Projected returns pro-forma
-3.0% appreciation · 2.35% rent growth · sell at horizon
- IRR
- -0.2%
- Equity multiple
- 0.99×
- Total profit
- $-284
- Equity at exit
- $16,998
- IRR
- 8.8%
- Equity multiple
- 1.65×
- Total profit
- $20,768
- Equity at exit
- $9,857
Cash invested: $31,920 (down + closing). Projections, not guarantees.
Landlord ↔ Tenant lean methodology
- Overall (STATE)
- 62 Landlord-Friendly
- State Michigan
- 62 Landlord-Friendly · EVEN
- County
- — inherits STATE
- City
- — inherits STATE
ZIP-level market 48091
- Rents YoY
- 2.4%
- Active inventory
- 170
- Price-to-rent
- 7.0×
Monthly cashflow live
- Estimated rent
- $1,358 high interval (Pro) →
- Mortgage (P&I)
- −$598
- Tax from tax record
- −$128 /mo · $1,541/yr
- Insurance
- −$48
- HOA
- −$0
- Vacancy / Maint / Mgmt
- −$285
- Net cashflow
- $299
Break-even live
Sensitivity live
| Price | -10% $364 | -5% $332 | +0% $299 | +5% $267 | +10% $235 |
|---|---|---|---|---|---|
| Rent | -10% $192 | -5% $246 | +0% $299 | +5% $353 | +10% $407 |
| Rate | -1.0pp $357 | -0.5pp $328 | base $299 | +0.5pp $270 | +1.0pp $240 |
UW: 25.0% down · 7.5% · 30yr · 1.5% tax · 5.0% vac · 8.0% maint · 8.0% mgmt
Financing live
Cash to close
- Down payment
- $28,500
- Closing costs
- $3,420
- Reserves months
- —
- Total cash needed
- —
Loan-product check · same deal, 3 products live
Conventional
25% down · 7.5% · 30yr
- Down + closing
- —
- Monthly P&I
- —
- Monthly cashflow
- —
- DSCR
- —
- Eligible?
- —
Personal DTI + credit; lowest rate.
DSCR
20% down · 8.5% · 30yr
- Down + closing
- —
- Monthly P&I
- —
- Monthly cashflow
- —
- DSCR
- —
- Eligible?
- —
No personal income docs; deal must DSCR.
Hard money
10% down · 12.0% · 12mo
- Down + closing
- —
- Monthly P&I
- —
- Monthly cashflow
- —
- DSCR
- —
- Eligible?
- —
Short-term bridge; refi at stabilization.
Rent comps 40 comps
| Address | Beds | Baths | Sqft | Rent | $/sqft | DOM | Units | Dist |
|---|---|---|---|---|---|---|---|---|
| 7275 Chalmers Ave Warren, MI | 2.0 | 1.0 | 703 | $1,200 | $1.71 | 25d | 1 | 0.19mi |
| 7511 Toepfer Rd Warren, MI | 3.0 | 1.0 | 1032 | $1,199 | $1.16 | 23d | 1 | 0.25mi |
| 8036 Hupp Ave Warren, MI | 2.0 | 1.0 | 680 | $1,150 | $1.69 | 45d | 1 | 0.28mi |
| 7043 Meadow Ave Warren, MI | 2.0 | 1.0 | 911 | $1,274 | $1.40 | 45d | 1 | 0.33mi |
| 6847 Continental Ave Warren, MI | 4.0 | 1.0 | 1000 | $1,595 | $1.59 | 0d | 1 | 0.40mi |
| 7060 Victory Ave Warren, MI | 3.0 | 1.0 | 945 | $1,450 | $1.53 | 13d | 1 | 0.41mi |
| 8251 Hudson Ave Warren, MI | 3.0 | 1.0 | 908 | $1,400 | $1.54 | 25d | 1 | 0.44mi |
| 7033 Westminster Ave Warren, MI | 2.0 | 1.0 | 561 | $1,050 | $1.87 | 45d | 1 | 0.45mi |
| 8065 Meadow Ave Warren, MI | 2.0 | 1.0 | 800 | $1,050 | $1.31 | 25d | 1 | 0.46mi |
| 8162 Orchard Ave Warren, MI | 2.0 | 1.0 | 900 | $1,000 | $1.11 | 45d | 1 | 0.50mi |
| 7605 Jackson Ave Warren, MI | 2.0 | 1.0 | 600 | $1,165 | $1.94 | 25d | 1 | 0.65mi |
| 8125 Timken Ave Warren, MI | 3.0 | 1.0 | 948 | $1,270 | $1.34 | 6d | 1 | 0.66mi |
| 8212 Timken Ave Warren, MI | 2.0 | 1.0 | 756 | $1,320 | $1.75 | 25d | 1 | 0.67mi |
| 8632 Studebaker Ave Warren, MI | 3.0 | 1.0 | 761 | $1,300 | $1.71 | 4d | 1 | 0.69mi |
| 8509 Paige Ave Warren, MI | 3.0 | 1.0 | 950 | $1,300 | $1.37 | 25d | 1 | 0.71mi |
| 8640 Chalmers Ave Warren, MI | 3.0 | 1.0 | 804 | $1,423 | $1.77 | 25d | 1 | 0.71mi |
| 8428 Timken Ave Warren, MI | 3.0 | 1.0 | 860 | $1,250 | $1.45 | 25d | 1 | 0.76mi |
| 8242 Jackson Ave Warren, MI | 3.0 | 1.0 | 840 | $1,198 | $1.43 | 45d | 1 | 0.79mi |
| 8636 Republic Ave Warren, MI | 2.0 | 1.0 | 800 | $1,250 | $1.56 | 16d | 1 | 0.81mi |
| 8693 Paige Ave Warren, MI | 3.0 | 1.0 | 900 | $1,300 | $1.44 | 25d | 1 | 0.81mi |
| 8285 Rivard Ave Warren, MI | 3.0 | 1.0 | 902 | $1,549 | $1.72 | 25d | 1 | 0.84mi |
| 8707 Continental Ave Warren, MI | 3.0 | 1.0 | 1100 | $1,200 | $1.09 | 6d | 1 | 0.85mi |
| 8707 Continental Ave Warren, MI | 3.0 | 1.0 | 968 | $1,200 | $1.24 | 19d | 1 | 0.85mi |
| 11076 Hudson Ave Warren, MI | 3.0 | 1.0 | 936 | $1,395 | $1.49 | 4d | 1 | 0.87mi |
| 21465 Syracuse Ave Warren, MI | 3.0 | 1.0 | 990 | $1,375 | $1.39 | 45d | 1 | 0.90mi |
| 22622 Panama Ave Warren, MI | 3.0 | 1.5 | 920 | $1,395 | $1.52 | 12d | 1 | 0.91mi |
| 8716 Timken Ave Warren, MI | 3.0 | 1.0 | 1008 | $1,400 | $1.39 | 25d | 1 | 0.93mi |
| 11236 Studebaker Ave Warren, MI | 2.0 | 1.0 | 672 | $1,175 | $1.75 | 45d | 1 | 0.97mi |
| 21410 Panama St Warren, MI | 3.0 | 1.0 | 900 | $1,600 | $1.78 | 25d | 1 | 1.00mi |
| 11319 Chalmers Ave Warren, MI | 3.0 | 1.0 | 975 | $1,500 | $1.54 | 25d | 1 | 1.03mi |
| 11076 Essex Ave Warren, MI | 4.0 | 1.0 | 1072 | $1,400 | $1.31 | 45d | 1 | 1.05mi |
| 11359 Maxwell Ave Unit 11359 Warren, MI | 2.0 | 1.0 | 900 | $1,000 | $1.11 | 5d | 1 | 1.07mi |
| 11228 Sherman Ave Warren, MI | 2.0 | 1.0 | 1000 | $1,200 | $1.20 | 14d | 1 | 1.08mi |
| 11331 Continental Ave Warren, MI | 2.0 | 1.0 | 765 | $1,250 | $1.63 | 25d | 1 | 1.11mi |
| 11130 Stephens Rd Warren, MI | 2.0 | 1.0 | 750 | $1,275 | $1.70 | 0d | 1 | 1.18mi |
| 20263 Caldwell St Detroit, MI | 3.0 | 1.0 | 909 | $1,350 | $1.49 | 18d | 1 | 1.27mi |
| 25005 Lawrence Ave Center Line, MI | 1.0–2.0 | 1.0–1.5 | 1000 | $955 | $0.95 | 45d | 1 | 1.30mi |
| 22580 Masch Ave Warren, MI | 3.0 | 1.0 | 988 | $1,450 | $1.47 | 25d | 1 | 1.30mi |
| 19691 Cliff St #1 Detroit, MI | 2.0 | 1.0 | 850 | $1,000 | $1.18 | 0d | 1 | 1.31mi |
| 19682 Rogge St Detroit, MI | 3.0 | 1.0 | 1000 | $1,350 | $1.35 | 0d | 1 | 1.32mi |
Listing history 33 events
-
2025-04-17status Pending 169-char remark
Show marketing remark (169 chars)
Move-in condition home that is affordably priced. Freshly painted interior, new flooring, newer furnace, vinyl windows, concrete driveway, basement for storage and more.
-
2025-02-04soldstatus $117,000
-
2024-12-18status Pending 169-char remark
Show marketing remark (169 chars)
Move-in condition home that is affordably priced. Freshly painted interior, new flooring, newer furnace, vinyl windows, concrete driveway, basement for storage and more.
-
2024-12-18status Pending 169-char remark
Show marketing remark (169 chars)
Move-in condition home that is affordably priced. Freshly painted interior, new flooring, newer furnace, vinyl windows, concrete driveway, basement for storage and more.
-
2024-12-18status Pending
Show marketing remark (169 chars)
Move-in condition home that is affordably priced. Freshly painted interior, new flooring, newer furnace, vinyl windows, concrete driveway, basement for storage and more.
-
2024-12-18historical 169-char remark
Show marketing remark (169 chars)
Move-in condition home that is affordably priced. Freshly painted interior, new flooring, newer furnace, vinyl windows, concrete driveway, basement for storage and more.
-
2024-12-12$114,000 Active 169-char remark
Show marketing remark (169 chars)
Move-in condition home that is affordably priced. Freshly painted interior, new flooring, newer furnace, vinyl windows, concrete driveway, basement for storage and more.
-
2024-12-12$114,000 Active 169-char remark
Show marketing remark (169 chars)
Move-in condition home that is affordably priced. Freshly painted interior, new flooring, newer furnace, vinyl windows, concrete driveway, basement for storage and more.
-
2024-12-12$114,000 Active
Show marketing remark (169 chars)
Move-in condition home that is affordably priced. Freshly painted interior, new flooring, newer furnace, vinyl windows, concrete driveway, basement for storage and more.
-
2022-09-20soldstatus $95,000
-
2022-09-14soldstatus $95,000 Sold
-
2022-09-14soldstatus $95,000 Closed
-
2022-09-06status Pending
-
2022-09-06status Pending
-
2022-09-02$89,900 Active
-
2022-09-02$89,900 Active
-
2012-03-09soldstatus $13,000
-
2012-03-09soldstatus $13,000
-
2012-02-22historical
-
2011-11-18$12,000
-
2011-11-18$12,000
-
2006-11-13historical
-
2006-11-13historical
-
2006-11-13historical
-
2006-05-27$85,000
-
2006-05-13$85,000
-
2006-05-13$85,000
-
2005-01-10historical
-
2004-10-14$89,900
-
2002-08-28soldstatus $60,000
-
2002-08-24soldstatus $60,000
-
2002-08-06historical
-
2002-07-30$65,000
ⓘ Source: listings_history table (triggers on properties + properties_extension) + one-shot
backfill from property_details.listing_events for pre-trigger history.
Tax reassessment forecast MI · Partial reset (capped growth)
- Current annual tax
- $1,541 · $128/mo
- Projected year-2 tax
- $1,648 · $137/mo
- Expected delta
- +$107/yr (+$9/mo · 7.0%)
ⓘ Screening estimate from a state-policy table — verify with the county assessor before closing.
Climate risk First Street
- Flood 1/10 Low FEMA zone X (unshaded) · 0% chance over 30 yrs
- Wildfire 1/10 Low
- Heat 3/10 Moderate 7 d/yr ≥97°F today · 15 d/yr by 30 yrs out
- Wind 1/10 Low
- Air quality 3/10 Moderate 3 unhealthy d/yr today · 4 by 30 yrs out
Nearby sold comps map
Loading sold comps map…
Walkable amenities ~0.75 mi
Loading nearby amenities…
Taxation est. · year 1
- Rental income
- $16,299
- − Mortgage interest
- −$6,386
- − Property taxes
- −$1,541
- − Insurance
- −$570
- − Repairs & maintenance
- −$1,304
- − Management
- −$1,304
- − Depreciation
- −$3,316
- Taxable income
- $1,878
- Est. tax owed @ 24.0%
- −$451
- After-tax cash flow
- $3,140/yr
For passive investors: Depreciation is non-cash, so a rental often shows a tax loss while cash-flowing — sheltering income. Rental losses are passive: they offset passive income freely, and up to $25,000/yr can offset ordinary (W-2) income if you actively participate and your MAGI is under $100k (phasing out to $0 by $150k); unused losses carry forward. On sale, claimed depreciation is recaptured at up to 25%, and gains may owe capital-gains tax (a 1031 exchange can defer both). Figures are a year-1 estimate at your 24.0% rate — not tax advice; consult a CPA.
Schools (NCES district)
- District
- Center Line Public Schools
- NCES district ID
- 2608580
- Math proficiency
- 14% ▼ -8.00%
- Reading proficiency
- 29% ▼ -3.00%
- Median HH income
- $38,011
- Composite
- 17.95/100
- National rank
- #8992
- State rank
- #459 of 540 in MI
Livability — Warren
- Score
- 74/100
- State rank
- #171
- US rank
- #4491
Category grades
Schools grade is shown separately in the Schools card above.
Census & demographics
- Census place
- Warren, MI
- County
- Macomb County · 638,552 people
- City population
- 114,937
- Metro
- Detroit-Warren-Dearborn, MI
- Population (ZIP)
- 30,696
- Household income
- $54,230
- Rent vs Own
- Severe rent burden
- 1296.0
Population outlook (Macomb County) Hauer SSP2
- Today (2025)
- 925,296 people
- By 2030
- 948,226 · +2.5%
- By 2040
- 983,961 · +6.3%
- By 2050
- 1,010,200 · +9.2%
- By 2075
- 1,076,222 · +16.3%
- By 2100
- 1,077,065 · +16.4%
Race, ethnicity, and origin ACS 2023
- Neighborhood character
- Diverse neighborhood (Simpson 0.68)
- Race & ethnicity
- White 47% Black 25% Asian 19% Two or more races 5% Hispanic / Latino 3% Native American 2%
- Common ancestry
- Romanian 7% Lithuanian 2% Slovak 1%
- Foreign-born
- 16% · Canada
- Languages at home
- 77% English-only · Other Indo-European 14% Other Asian/Pacific 3% Russian/Polish/Slavic 2%
Political lean MEDSL · Macomb
- 2024 margin
- R (+13.7) · D 42.2% · R 55.9% · Other 1.9%
- 2008→2024 swing
- -22.3pp toward R · 2008: 8.6pp · 2024: -13.7pp
- All cycles
- 2024: R+13.7 2020: R+8.1 2016: R+11.6 2012: D+4.0 2008: D+8.6
Not yet ingested
- Civics
- —
Market trends
- HPI YoY
- ▼ -199.66%
- Current HPI
- 177.9273
- Rent YoY
- ▲ 2.35%
- Metro
- Detroit-Warren-Dearborn, MI
- State GDP YoY
- ▲ 1.37%
- F500 in state
- 28
Industry mix (Fortune 500 HQ in MI)
| Industry | F500 HQs | Revenue |
|---|---|---|
| Automotive Parts | 3 | $48B |
|
||
| Automotive | 2 | $372B |
|
||
| Chemicals | 1 | $45B |
|
||
| Automotive Retail | 1 | $29B |
|
||
| Healthcare / Medical Devices | 1 | $23B |
|
||
| Automotive Technology | 1 | $20B |
|
||
Price history
+80.0% since first listed33 events — show timeline
- 2025-04-17 Pending — REALCOMP
- 2025-02-04 Sold (Public Records) $117,000 Public Records
- 2024-12-18 Pending — REALCOMP
- 2024-12-18 Pending — MiRealSource-MiMLS
- 2024-12-18 Pending — SW Michigan MLS
- 2024-12-18 Listing Removed — REALCOMP
- 2024-12-12 Listed $114,000 SW Michigan MLS
- 2024-12-12 Listed $114,000 MiRealSource-MiMLS
- 2024-12-12 Listed $114,000 REALCOMP
- 2022-09-20 Sold (Public Records) $95,000 Public Records
- 2022-09-14 Sold (MLS) $95,000 MiRealSource-MiMLS
- 2022-09-14 Sold (MLS) $95,000 REALCOMP
- 2022-09-06 Pending — MiRealSource-MiMLS
- 2022-09-06 Pending — REALCOMP
- 2022-09-02 Listed $89,900 MiRealSource-MiMLS
- 2022-09-02 Listed $89,900 REALCOMP
- 2012-03-09 Sold (MLS) $13,000 MiRealSource-MiMLS
- 2012-03-09 Sold (MLS) $13,000 REALCOMP
- 2012-02-22 Listing Removed — MiRealSource-MiMLS
- 2011-11-18 Listed $12,000 MiRealSource-MiMLS
- 2011-11-18 Listed $12,000 REALCOMP
- 2006-11-13 Listing Removed — MiRealSource-MiMLS
- 2006-11-13 Listing Removed — MiRealSource-MiMLS
- 2006-11-13 Listing Removed — REALCOMP
- 2006-05-27 Listed $85,000 MiRealSource-MiMLS
- 2006-05-13 Listed $85,000 MiRealSource-MiMLS
- 2006-05-13 Listed $85,000 REALCOMP
- 2005-01-10 Listing Removed — MiRealSource-MiMLS
- 2004-10-14 Listed $89,900 MiRealSource-MiMLS
- 2002-08-28 Sold (Public Records) $60,000 Public Records
- 2002-08-24 Sold (MLS) $60,000 MiRealSource-MiMLS
- 2002-08-06 Listing Removed — MiRealSource-MiMLS
- 2002-07-30 Listed $65,000 MiRealSource-MiMLS
Property tax history
+7.0%/yrLatest (2025): $1,541 · -9.1% YoY. Source: county tax records.
Cash-flow waterfall
monthlySold comps — $/sqft
last 12 mo · ≤1 miLoading sold comps…