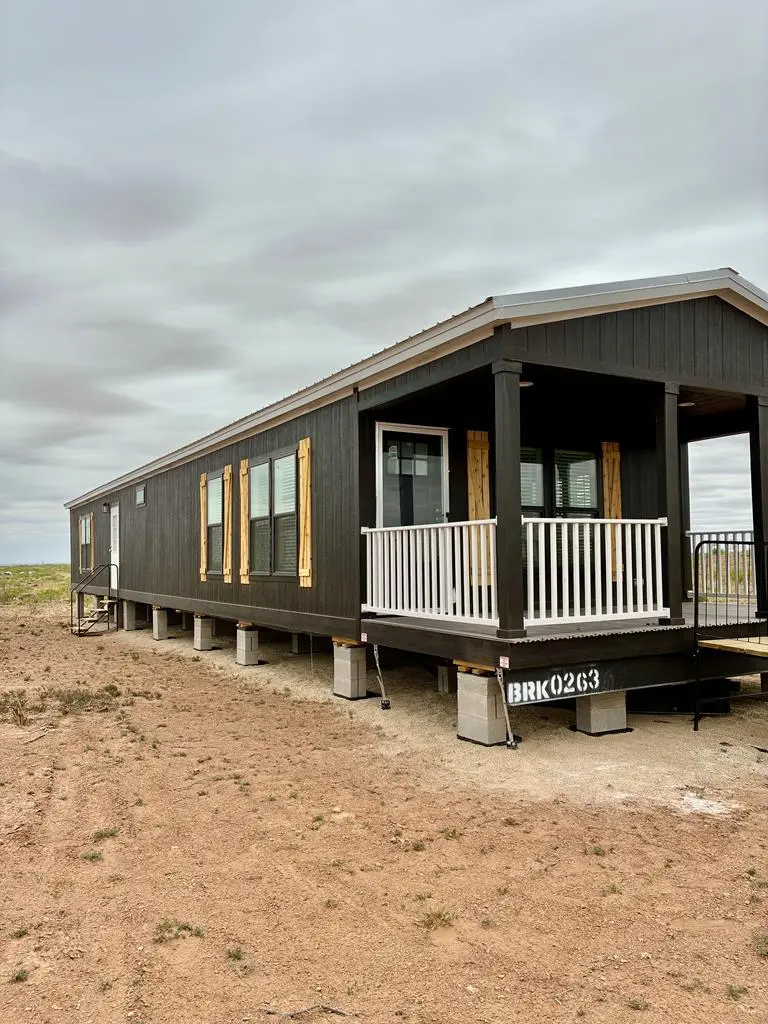
1923 Private Road Montoya
Stanton, TX 79782
$225,000D-
3 bd · 2.0 ba ·
1,314 sqft ·
Built 2026
· SingleFamily
· Active
· 7 DOM
Cashflow @ list (25.0% down · 7.5%)
Estimated rent
$1,539/mo
Mortgage (P&I)
−$1,180
Tax + insurance
−$375
HOA
−$0
Vac / Maint / Mgmt
−$323
Net cashflow
$-339/mo
Annual
$-4,069/yr
Cap rate
4.48%
Cash-on-cash
-6.46%
DSCR
0.71
1% rule
0.68%
Cash to close
$63,000
Investor read
- This is a 3-bed/2.0-bath single-family listed at $225k.
- At list price, monthly cash flow is $-339 ($-4k/yr) — negative.
- To cash-flow at today's rent, offer at most $176k (21.8% below list).
- To meet the 1% rule (rent ≥ 1% of price), the offer needs to be $154k (31.6% below list).
- Only 7 days on market — expect competitive offers; lowballing is unlikely to land.
- Recommended offer: $154k (31.6% below list) — sets the bar for 1% rule.
- In year one you build about $16k of equity ($2k loan paydown + $14k appreciation (6.3% local appreciation)).
- Location reads 75/100 on livability (#140 in TX, #4,008 nationally) — a middle-class / working-renter tenant base. Strengths: cost of living A+, housing A+, health & safety A+; Watch: amenities F, commute F.
- Stanton ISD (rural): math 40% / reading 39% proficiency, ranked #426 of 826 in TX (top 52%) — families likely to look elsewhere, expect single-tenant / working-renter base with shorter leases.
- Zoned schools: Stanton El (math 43% / reading 37%, grade F, #1,514 of 4,322 statewide, top 36%, 518 students, 59% FRL); Stanton Middle (math 37% / reading 38%, grade F, #736 of 1,662 statewide, top 45%, 256 students, 54% FRL); Stanton H S (math 44% / reading 47%, grade D-, #630 of 1,632 statewide, top 39%, 307 students, 39% FRL).
- Market conditions: 39 active listings in the ZIP; 5 units permitted in Martin County in 2024 (0 in 5+ unit buildings).
- Martin County population projected at +74% by 2050 — long-run rental-demand tailwind backs the buy-and-hold thesis.
- By year 3, paydown + projected appreciation supports a ~$39k cash-out refi (75% LTV) — recoverable capital for the next deal without selling this one.
Questions for listing agent
- What do current leases actually rent for vs. the listed asking? Can we see a recent rent roll and the last 12 months of T-12 income?
- Is there a deadline driving the sale (1031 exchange, divorce, estate, relocation)? That informs how much negotiation room exists.
- Schools are D-rated, which usually means shorter tenancies and higher turnover. Who's the typical renter profile here, and what's been the actual vacancy rate?
- The area grade is low — what's the realistic commute time and amenity access for the typical tenant pool here? Any planned neighborhood developments (good or bad) we should know about?
- What's the average days-on-market for RENTAL listings here right now (not sales)? A rising rental-DOM trend means longer vacancies and softer asking-rent achievability than the comps imply.
- What's the recent tenant-quality profile in this submarket — average credit score on applications, eviction rate, late-payment / NSF rate, and stable-employment percentage? A property-management company in the area should have these aggregated.
- How much new for-sale + rental construction is in the pipeline within 1–3 miles? Heavy new supply typically softens prices + rents 12–24 months out; constrained supply supports both.
CashFlowRE · CFR-W8Z5F069D0RH4E
· Data 1 day ago
cashflowre.app · 2026-05-29