1923 Private Road Montoya · Stanton, TX
Flood risk No data
- FEMA flood zone
- —
- Chance of flooding over 30 yrs
- —
- Est. flood insurance / yr
- —
Fire risk No data
- Est. fire insurance / yr
- —
Heat risk No data
- Hot days now (above threshold)
- —
- Hot days in 30 yrs
- —
Wind risk No data
- Chance of severe wind over 30 yrs
- —
Air-quality risk No data
- Unhealthy air days now
- —
- Unhealthy air days in 30 yrs
- —
Risk factors via First Street. Map © Google.
Why this score? — see what drove the D- grade
The composite is a weighted blend of 9 inputs, each scored 0–100. Each bar is that input's sub-score; the figure is the points it added to the 100-point composite (weight × sub-score).
- Appreciation +8.1/10.0
- ARV discount +7.5/15.0
- Cash flow +6.9/30.0
- Livability +3.8/5.0
- Schools +3.4/10.0
- Rent growth +2.5/5.0
- Condition / age +2.5/5.0
- 1% rule +1.8/10.0
- DSCR +1.1/10.0
$225,000
🖨 Deal sheet (PDF) 📄 Offer letter ✓ Due diligence
Listing remarks
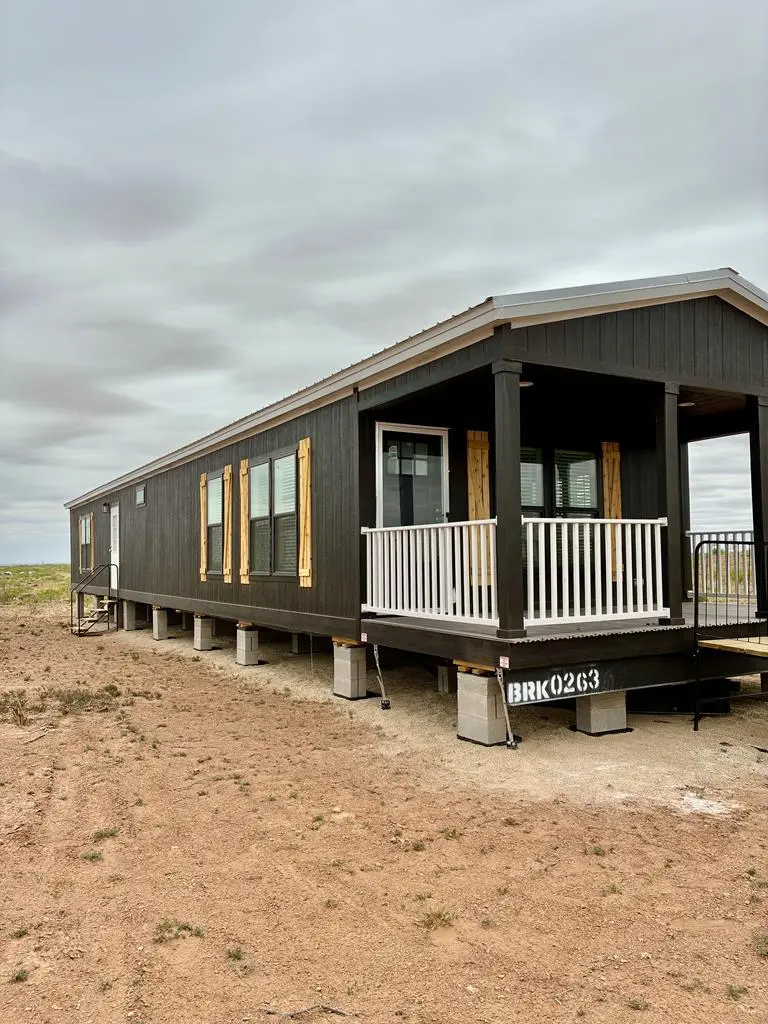
12.44 Acres of raw land, a beautiful brand new 2026 18 x 80 singlewide mobile home that has been placed at property. Home has not been set up, the beauty of this is that LAND and or MOBILE HOME can be sold separately. Yes! Dreamed about living out in the county, have cattle, chickens, goats? Great location close to everything, 10 minutes' drive from Stanton downtown. Great Developers opportunity! Don't Miss it!!
Key facts
- 12.44 acre lot
- Garage
- Built 2026
Property features AI
Finance
- Financial info: Annual tax amount approximately $1,500
Exterior
- Parking: Detached garage
- Home design: Single family residence; One story
- Construction: Wood siding construction
- Exterior features: Metal roof; Approximately 12.44 acres
Interior
- Kitchen: Microwave; Electric range
- Bathrooms: 2 full bathrooms
- Heating & cooling: Electric heating; Central air; Ceiling fans
- Interior features: Pantry
- Laundry & utility: Electric water heater
Neighborhood map
What this means for you Summary
Snapshot
- This is a 3-bed/2.0-bath single-family listed at $225k.
Deal economics
- At list price, monthly cash flow is $-339 ($-4k/yr) — negative.
- To cash-flow at today's rent, offer at most $176k (21.8% below list).
- To meet the 1% rule (rent ≥ 1% of price), the offer needs to be $154k (31.6% below list).
- Recommended offer: $154k (31.6% below list) — sets the bar for 1% rule.
Location & tenants
- Location reads 75/100 on livability (#140 in TX, #4,008 nationally) — a middle-class / working-renter tenant base. Strengths: cost of living A+, housing A+, health & safety A+; Watch: amenities F, commute F.
- Stanton ISD (rural): math 40% / reading 39% proficiency, ranked #426 of 826 in TX (top 52%) — families likely to look elsewhere, expect single-tenant / working-renter base with shorter leases.
- Zoned schools: Stanton El (math 43% / reading 37%, grade F, #1,514 of 4,322 statewide, top 36%, 518 students, 59% FRL); Stanton Middle (math 37% / reading 38%, grade F, #736 of 1,662 statewide, top 45%, 256 students, 54% FRL); Stanton H S (math 44% / reading 47%, grade D-, #630 of 1,632 statewide, top 39%, 307 students, 39% FRL).
- Market conditions: 39 active listings in the ZIP; 5 units permitted in Martin County in 2024 (0 in 5+ unit buildings).
Forward outlook
- In year one you build about $16k of equity ($2k loan paydown + $14k appreciation (6.3% local appreciation)).
- Martin County population projected at +74% by 2050 — long-run rental-demand tailwind backs the buy-and-hold thesis.
- By year 3, paydown + projected appreciation supports a ~$39k cash-out refi (75% LTV) — recoverable capital for the next deal without selling this one.
Negotiation context
- Only 7 days on market — expect competitive offers; lowballing is unlikely to land.
Questions for the listing agent
- What do current leases actually rent for vs. the listed asking? Can we see a recent rent roll and the last 12 months of T-12 income?
- Is there a deadline driving the sale (1031 exchange, divorce, estate, relocation)? That informs how much negotiation room exists.
- Schools are D-rated, which usually means shorter tenancies and higher turnover. Who's the typical renter profile here, and what's been the actual vacancy rate?
- The area grade is low — what's the realistic commute time and amenity access for the typical tenant pool here? Any planned neighborhood developments (good or bad) we should know about?
- What's the average days-on-market for RENTAL listings here right now (not sales)? A rising rental-DOM trend means longer vacancies and softer asking-rent achievability than the comps imply.
- What's the recent tenant-quality profile in this submarket — average credit score on applications, eviction rate, late-payment / NSF rate, and stable-employment percentage? A property-management company in the area should have these aggregated.
- How much new for-sale + rental construction is in the pipeline within 1–3 miles? Heavy new supply typically softens prices + rents 12–24 months out; constrained supply supports both.
Investment metrics
- 1% rule
- 0.68% ✗
- Cap rate
- 4.48%
- Cash-on-cash
- -6.46%
- DSCR
- 0.71
- GRM
- 12.2
CMA / ARV
No comps found within radius.
Projected returns pro-forma
6.3% appreciation · 3.0% rent growth · sell at horizon
- IRR
- 10.9%
- Equity multiple
- 1.75×
- Total profit
- $47,362
- Equity at exit
- $145,670
- IRR
- 11.9%
- Equity multiple
- 3.46×
- Total profit
- $155,283
- Equity at exit
- $267,892
Cash invested: $63,000 (down + closing). Projections, not guarantees.
Landlord ↔ Tenant lean methodology
- Overall (STATE)
- 87 Strongly Landlord-Friendly
- State Texas
- 87 Strongly Landlord-Friendly · R+5
- County
- — inherits STATE
- City
- — inherits STATE
ZIP-level market 79782
- Home prices YoY
- 3.3%
- Active inventory
- 39
- Price-to-rent
- 12.2×
Monthly cashflow live
- Estimated rent
- $1,539 medium interval (Pro) →
- Mortgage (P&I)
- −$1,180
- Tax est. 1.5%
- −$281 /mo · $3,375/yr
- Insurance
- −$94
- HOA
- −$0
- Vacancy / Maint / Mgmt
- −$323
- Net cashflow
- $-339
Break-even live
Sensitivity live
| Price | -10% $-184 | -5% $-261 | +0% $-339 | +5% $-417 | +10% $-495 |
|---|---|---|---|---|---|
| Rent | -10% $-461 | -5% $-400 | +0% $-339 | +5% $-278 | +10% $-217 |
| Rate | -1.0pp $-226 | -0.5pp $-282 | base $-339 | +0.5pp $-397 | +1.0pp $-457 |
UW: 25.0% down · 7.5% · 30yr · 1.5% tax · 5.0% vac · 8.0% maint · 8.0% mgmt
Financing live
Cash to close
- Down payment
- $56,250
- Closing costs
- $6,750
- Reserves months
- —
- Total cash needed
- —
Loan-product check · same deal, 3 products live
Conventional
25% down · 7.5% · 30yr
- Down + closing
- —
- Monthly P&I
- —
- Monthly cashflow
- —
- DSCR
- —
- Eligible?
- —
Personal DTI + credit; lowest rate.
DSCR
20% down · 8.5% · 30yr
- Down + closing
- —
- Monthly P&I
- —
- Monthly cashflow
- —
- DSCR
- —
- Eligible?
- —
No personal income docs; deal must DSCR.
Hard money
10% down · 12.0% · 12mo
- Down + closing
- —
- Monthly P&I
- —
- Monthly cashflow
- —
- DSCR
- —
- Eligible?
- —
Short-term bridge; refi at stabilization.
Listing history 8 events
-
2026-06-19days on market $225,000 Active 7 DOM
-
2026-06-18days on market $225,000 Active 6 DOM
-
2026-06-17days on market $225,000 Active 5 DOM
-
2026-06-16days on market $225,000 Active 4 DOM
-
2026-06-15days on market $225,000 Active 3 DOM
-
2026-06-13$225,000 Active 1 DOM
-
2026-06-10remarks 415-char remark
-
2026-06-10$225,000 Active 1 DOM
ⓘ Source: listings_history table (triggers on properties + properties_extension) + one-shot
backfill from property_details.listing_events for pre-trigger history.
Nearby sold comps map
Loading sold comps map…
Walkable amenities ~0.75 mi
Loading nearby amenities…
Taxation est. · year 1
- Rental income
- $18,468
- − Mortgage interest
- −$12,603
- − Property taxes
- −$3,375
- − Insurance
- −$1,125
- − Repairs & maintenance
- −$1,477
- − Management
- −$1,477
- − Depreciation
- −$6,545
- Taxable loss
- −$8,135
- Est. tax savings @ 24.0%
- +$1,953
- After-tax cash flow
- $-2,116/yr
For passive investors: Depreciation is non-cash, so a rental often shows a tax loss while cash-flowing — sheltering income. Rental losses are passive: they offset passive income freely, and up to $25,000/yr can offset ordinary (W-2) income if you actively participate and your MAGI is under $100k (phasing out to $0 by $150k); unused losses carry forward. On sale, claimed depreciation is recaptured at up to 25%, and gains may owe capital-gains tax (a 1031 exchange can defer both). Figures are a year-1 estimate at your 24.0% rate — not tax advice; consult a CPA.
Schools (NCES district)
- District
- Stanton ISD
- NCES district ID
- 4841430
- Math proficiency
- 40% ▼ -1.00%
- Reading proficiency
- 39% ▲ 5.00%
- Median HH income
- $47,595
- Composite
- 33.86/100
- National rank
- #5353
- State rank
- #426 of 826 in TX
Livability — Stanton
- Score
- 75/100
- State rank
- #140
- US rank
- #4008
Category grades
Schools grade is shown separately in the Schools card above.
Census & demographics
- Population (ZIP)
- 3,831
Population outlook (Martin County) Hauer SSP2
- Today (2025)
- 7,556 people
- By 2030
- 8,556 · +13.2%
- By 2040
- 10,786 · +42.7%
- By 2050
- 13,158 · +74.1%
- By 2075
- 19,334 · +155.9%
- By 2100
- 23,704 · +213.7%
Race, ethnicity, and origin ACS 2023
- Neighborhood character
- Majority Hispanic (53%)
- Race & ethnicity
- Hispanic / Latino 53% White 43% Two or more races 8% Black 2%
- Hispanic origin (detail)
- Mexican 51%
- Common ancestry
- Slovak 1% Italian 1% Scotch-Irish 1%
- Foreign-born
- 10% · Canada
- Languages at home
- 65% English-only · Spanish 33% German/W. Germanic 2%
Political lean MEDSL · Martin
- 2024 margin
- Solid R (+75.8) · D 11.9% · R 87.6%
- 2008→2024 swing
- -13.1pp toward R · 2008: -62.7pp · 2024: -75.8pp
- All cycles
- 2024: R+75.8 2020: R+72.6 2016: R+67.6 2012: R+68.5 2008: R+62.7
Not yet ingested
- Civics
- —
Market trends
- HPI YoY
- ▲ 6.30%
- Current HPI
- 195.1131
- Rent YoY
- —
- Metro
- —
- State GDP YoY
- ▲ 3.95%
- F500 in state
- 110
Industry mix (Fortune 500 HQ in TX)
| Industry | F500 HQs | Revenue |
|---|---|---|
| Energy | 16 | $1,198B |
|
||
| Technology | 5 | $198B |
|
||
| Engineering / Construction | 4 | $72B |
|
||
| Energy Services | 3 | $60B |
|
||
| Utilities | 3 | $41B |
|
||
| Healthcare | 2 | $330B |
|
||
Price history
1 event — show timeline
- 2026-06-07 Listed $225,000 PBBOR
Cash-flow waterfall
monthlySold comps — $/sqft
last 12 mo · ≤1 miLoading sold comps…