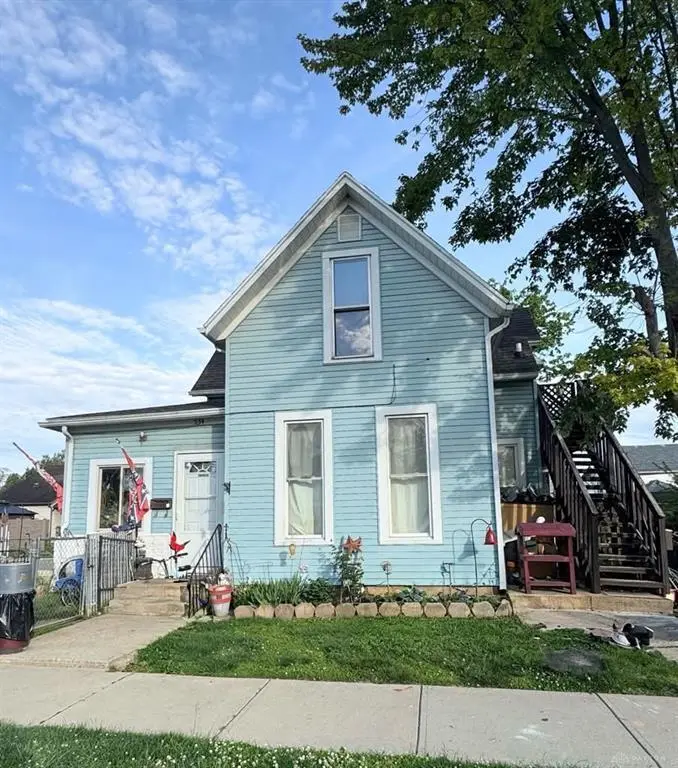
534 S Walnut St
Troy, OH 45373
$164,900B
4 bd · 2.0 ba ·
1,556 sqft ·
Built 1894
· MultiFamily
· Pending
· 19 DOM
Cashflow @ list (25.0% down · 7.5%)
Estimated rent
$2,248/mo
Mortgage (P&I)
−$865
Tax + insurance
−$143
HOA
−$0
Vac / Maint / Mgmt
−$472
Net cashflow
$768/mo
Annual
$9,219/yr
Cap rate
11.88%
Cash-on-cash
19.97%
DSCR
1.89
1% rule
1.36%
Cash to close
$46,172
Investor read
- This is a 2 × 2-bed/1.0-bath units multifamily listed at $165k.
- At list price, monthly cash flow is $768 ($9k/yr) — positive. Per door: $384/mo.
- The deal already cash-flows at list — no discount required.
- Meets the 1% rule at list price ($2k rent vs $165k).
- It's been on market 19 days — a 2% lower offer ($162k) is reasonable based on typical stale-listing flexibility.
- Recommended offer: $162k (1.5% below list) — sets the bar for market timing.
- Local home prices are declining (-3.0%/yr); year-one equity from $1k of loan paydown is wiped out by about $5k of value loss. Plan a longer hold.
- Location reads 73/100 on livability (#345 in OH) — a middle-class / working-renter tenant base. Strengths: cost of living A+, housing A+, crime A; Watch: amenities F, commute F, health & safety F.
- Troy City (suburban): math 61% / reading 61% proficiency, ranked #271 of 656 in OH (top 41%) — acceptable for families but not a draw, mixed tenant base, ~2y average lease.
- Watch-outs: built in 1894 — expect roof / HVAC / electrical / plumbing capex.
- Market conditions: Rents rising fast (+5.1%/yr); 281 active listings in the ZIP; 4 comparable units currently listed for rent nearby; rentals at typical pace (median 15d on market — plan ~3-4 weeks tenant-placement turnaround); solid renter incomes; 326 units permitted in Miami County in 2024 (0 in 5+ unit buildings).
- 2 sale attempts with the ask held roughly flat each time — persistent listings suggest the price (not the market) is what's stuck; bring a comps-based counter.
- Current owner paid $73k; list at $165k implies a 125% gain — meaningful room to come down on a strong offer.
- At projected returns (-3.0% appreciation + 5.1% rent growth), your $46k cash investment doubles in ~6 years — after that, you're playing with house money.
- Cap rate 11.9% vs local median 2.6% in Troy — top-decile yield for the area; either an underpriced asset or a hidden risk that comps aren't pricing in. Stress-test before assuming the spread holds.
- This rent runs 36% of the median local income ($76k/yr) — at the standard rent-burdened threshold; future hikes will face affordability resistance.
Questions for listing agent
- Can we see the unit-by-unit rent roll, current vacancy, and any below-market leases? What's the average tenancy length?
- What capital expenditures (roof, boiler, parking lot, exteriors) have been made in the last 5 years, and what's planned in the next 2?
- Built in 1894 — when were the roof, HVAC, electrical panel, plumbing, and water heater last replaced?
- Is there a deadline driving the sale (1031 exchange, divorce, estate, relocation)? That informs how much negotiation room exists.
- Schools are A-rated — typically a magnet for longer-tenancy family renters. What's the average tenant stay here, and is there a school-zone premium baked into asking?
- What's the average days-on-market for RENTAL listings here right now (not sales)? A rising rental-DOM trend means longer vacancies and softer asking-rent achievability than the comps imply.
- What's the recent tenant-quality profile in this submarket — average credit score on applications, eviction rate, late-payment / NSF rate, and stable-employment percentage? A property-management company in the area should have these aggregated.
- How much new apartment / multifamily construction is in the pipeline within 1–3 miles? Heavy new supply (>2% of stock underway) typically softens rents 12–24 months out; light construction supports rent growth.
CashFlowRE · CFR-W9301J35WAF9VD
· Data 2 weeks ago
cashflowre.app · 2026-05-29