 Duplex
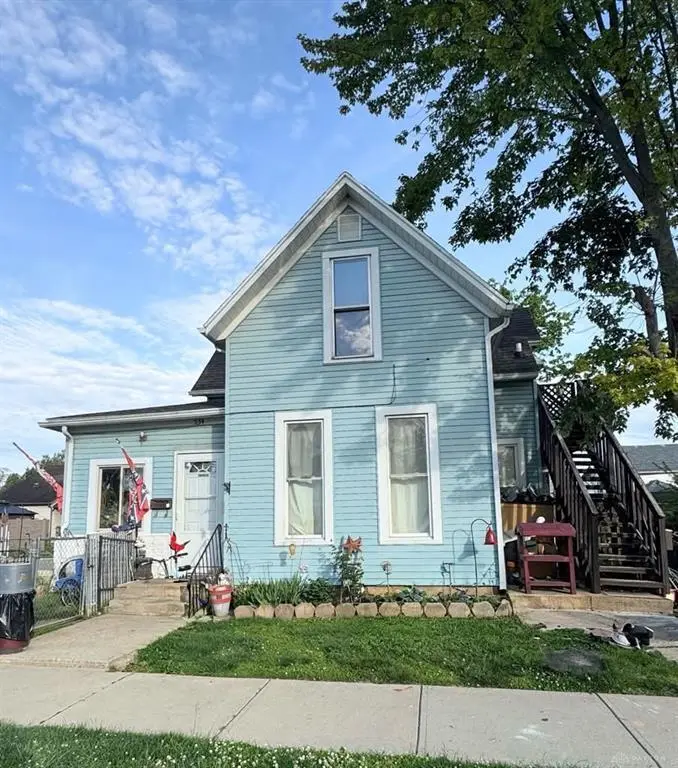
534 S Walnut St · Troy, OH
Flood risk 1/10 · Minimal
- FEMA flood zone
- X (unshaded)
- Chance of flooding over 30 yrs
- 0.0%
- Est. flood insurance / yr
- $473 – $860
Fire risk 1/10 · Minimal
- Est. fire insurance / yr
- $713 – $1,323
Heat risk 4/10 · Minor
- Hot days now (above 102°F)
- 7 days/yr
- Hot days in 30 yrs
- 18 days/yr
Wind risk 2/10 · Minimal
- Chance of severe wind over 30 yrs
- —
Air-quality risk 3/10 · Minor
- Unhealthy air days now
- 3 days/yr
- Unhealthy air days in 30 yrs
- 4 days/yr
Risk factors via First Street. Map © Google.
Why this score? — see what drove the B grade
The composite is a weighted blend of 9 inputs, each scored 0–100. Each bar is that input's sub-score; the figure is the points it added to the 100-point composite (weight × sub-score).
- Cash flow +30.0/30.0
- DSCR +10.0/10.0
- 1% rule +8.6/10.0
- ARV discount +7.1/15.0
- Schools +5.2/10.0
- Rent growth +3.8/5.0
- Livability +3.7/5.0
- Condition / age +2.5/5.0
- Appreciation +0.0/10.0
$164,900
🖨 Deal sheet 📄 Offer letter ✓ Due diligence
Multi-family units
County records classify this as Multi-Family (2-4 Unit). Listing-text estimate: 2 units. confirmed
Listing remarks MLS
Discover an exceptional multi-family residence in Troy, offering spacious living and income potential. This property, with 3 bedrooms and 3 full bathrooms across 1,783 square feet, provides accessibility in its layout. Each unit includes a range and refrigerator. The 0.22-acre lot features a patio and porch, perfect for relaxation.New roof, new flooring, and toilets. Seller is willing to package for a portfolio deal, please contact agent for qualifying parcels and rents.
Key facts
- Ensuring privacy
- Flexible layout
- 3,920 sq ft lot
Tags
Property features AI
Finance
- Other: Two-unit building (one building total)
- Financial info: Property listed for sale; Reported gross income: $14,400 (multi-unit)
Exterior
- Parking: No garage
- Home design: Two-story building; Frame construction with vinyl siding
- Construction: Frame construction; Vinyl siding
- Exterior features: Residential lot (approximately 0.09 acres); Lot dimensions about 51 x 78 feet
Interior
- Bedrooms: Two-bedroom unit; Three-bedroom unit
- Bathrooms: 2 full bathrooms (total for property)
- Heating & cooling: Electric heating; Window air conditioning units
- Interior features: Full basement
Neighborhood map
What this means for you Summary
Snapshot
- This is a 2 × 2-bed/1.0-bath units multifamily listed at $165k.
Deal economics
- At list price, monthly cash flow is $768 ($9k/yr) — positive. Per door: $384/mo.
- The deal already cash-flows at list — no discount required.
- Meets the 1% rule at list price ($2k rent vs $165k).
- Recommended offer: $162k (1.5% below list) — sets the bar for market timing.
- Cap rate 11.9% vs local median 2.6% in Troy — top-decile yield for the area; either an underpriced asset or a hidden risk that comps aren't pricing in. Stress-test before assuming the spread holds.
Location & tenants
- Location reads 73/100 on livability (#345 in OH) — a middle-class / working-renter tenant base. Strengths: cost of living A+, housing A+, crime A; Watch: amenities F, commute F, health & safety F.
- Troy City (suburban): math 61% / reading 61% proficiency, ranked #271 of 656 in OH (top 41%) — acceptable for families but not a draw, mixed tenant base, ~2y average lease.
- Market conditions: Rents rising fast (+5.1%/yr); 281 active listings in the ZIP; 4 comparable units currently listed for rent nearby; rentals at typical pace (median 14d on market — plan ~3-4 weeks tenant-placement turnaround); solid renter incomes; 326 units permitted in Miami County in 2024 (0 in 5+ unit buildings).
- This rent runs 36% of the median local income ($76k/yr) — at the standard rent-burdened threshold; future hikes will face affordability resistance.
Forward outlook
- Local home prices are declining (-3.0%/yr); year-one equity from $1k of loan paydown is wiped out by about $5k of value loss. Plan a longer hold.
- At projected returns (-3.0% appreciation + 5.1% rent growth), your $46k cash investment doubles in ~6 years — after that, you're playing with house money.
Negotiation context
- It's been on market 19 days — a 2% lower offer ($162k) is reasonable based on typical stale-listing flexibility.
- 2 sale attempts with the ask held roughly flat each time — persistent listings suggest the price (not the market) is what's stuck; bring a comps-based counter.
- Current owner paid $73k; list at $165k implies a 125% gain — meaningful room to come down on a strong offer.
Risks & watch-outs
- Watch-outs: built in 1894 — expect roof / HVAC / electrical / plumbing capex.
Questions for the listing agent
- Can we see the unit-by-unit rent roll, current vacancy, and any below-market leases? What's the average tenancy length?
- What capital expenditures (roof, boiler, parking lot, exteriors) have been made in the last 5 years, and what's planned in the next 2?
- Built in 1894 — when were the roof, HVAC, electrical panel, plumbing, and water heater last replaced?
- Is there a deadline driving the sale (1031 exchange, divorce, estate, relocation)? That informs how much negotiation room exists.
- Schools are A-rated — typically a magnet for longer-tenancy family renters. What's the average tenant stay here, and is there a school-zone premium baked into asking?
- What's the average days-on-market for RENTAL listings here right now (not sales)? A rising rental-DOM trend means longer vacancies and softer asking-rent achievability than the comps imply.
- What's the recent tenant-quality profile in this submarket — average credit score on applications, eviction rate, late-payment / NSF rate, and stable-employment percentage? A property-management company in the area should have these aggregated.
- How much new apartment / multifamily construction is in the pipeline within 1–3 miles? Heavy new supply (>2% of stock underway) typically softens rents 12–24 months out; light construction supports rent growth.
Investment metrics
- 1% rule
- 1.36% ✓
- Cap rate
- 11.88%
- Cash-on-cash
- 19.97%
- DSCR
- 1.89
- GRM
- 6.1
CMA / ARV
- ARV (on-the-fly)
- $163,380
- Comps found
- 8
Show comp detail 8 sales within ~0.75 mi
| Address | Dist | Beds/Ba | Sqft | Sold | Price | $/sf | Match |
|---|---|---|---|---|---|---|---|
| 624 S Clay St | 0.15mi | 4/2.0 | 1,601 (+3%) | 12mo | $100,000 | $62 | 78 |
| 426 S Clay St | 0.15mi | 3/2.0 (-1) | 1,520 (-2%) | 11mo | $159,500 | $105 | 75 |
| 610-612 S Walnut St | 0.03mi | 3/2.0 (-1) | 1,583 (+2%) | 23mo | $140,000 | $88 | 72 |
| 710 S Mulberry St | 0.10mi | 3/2.0 (-1) | 1,680 (+8%) | 13mo | $140,000 | $83 | 66 |
| 131 S Mulberry St | 0.32mi | 3/2.0 (-1) | 1,705 (+10%) | 9mo | $203,000 | $119 | 57 |
| 818 E Canal St | 0.57mi | 3/2.0 (-1) | 1,670 (+7%) | 10mo | $92,000 | $55 | 48 |
| 9 N Mulberry St | 0.49mi | 4/2.0 | 1,768 (+14%) | 14mo | $246,000 | $139 | 43 |
| 320 Garfield Ave | 0.51mi | 5/3.5 (+1) | 1,632 (+5%) | 23mo | $280,000 | $172 | 38 |
Match score weights: distance 35% · size 25% · config 20% · recency 20%. Top-matched comps best support the ARV.
Projected returns pro-forma
-3.0% appreciation · 5.06% rent growth · sell at horizon
- IRR
- 14.2%
- Equity multiple
- 1.58×
- Total profit
- $26,917
- Equity at exit
- $24,587
- IRR
- 24.4%
- Equity multiple
- 3.31×
- Total profit
- $106,605
- Equity at exit
- $14,258
Cash invested: $46,172 (down + closing). Projections, not guarantees.
Landlord ↔ Tenant lean methodology
- Overall (STATE)
- 73 Landlord-Friendly
- State Ohio
- 73 Landlord-Friendly · R+6
- County
- — inherits STATE
- City
- — inherits STATE
ZIP-level market 45373
- Rents YoY
- 5.1%
- Active inventory
- 281
- Price-to-rent
- 12.2×
Monthly cashflow live
- Estimated rent
- $2,248 high interval (Pro) →
- Mortgage (P&I)
- −$865
- Tax from tax record
- −$74 /mo · $890/yr
- Insurance
- −$69
- HOA
- −$0
- Vacancy / Maint / Mgmt
- −$472
- Net cashflow
- $768
Break-even live
2-unit breakdown (identical units grouped — click to expand)
| Units | Beds | Baths | Est. rent |
|---|---|---|---|
| 2× units | 2 | 1 | $2,248 |
| #1 | 2 | 1 | $1,124 |
| #2 | 2 | 1 | $1,124 |
| Total (2 units) | $2,248 | ||
UW: 25.0% down · 7.5% · 30yr · 1.5% tax · 5.0% vac · 8.0% maint · 8.0% mgmt
Financing live
Cash to close
- Down payment
- $41,225
- Closing costs
- $4,947
- Reserves months
- —
- Total cash needed
- —
Loan-product check · same deal, 3 products live
Conventional
25% down · 7.5% · 30yr
- Down + closing
- —
- Monthly P&I
- —
- Monthly cashflow
- —
- DSCR
- —
- Eligible?
- —
Personal DTI + credit; lowest rate.
DSCR
20% down · 8.5% · 30yr
- Down + closing
- —
- Monthly P&I
- —
- Monthly cashflow
- —
- DSCR
- —
- Eligible?
- —
No personal income docs; deal must DSCR.
Hard money
10% down · 12.0% · 12mo
- Down + closing
- —
- Monthly P&I
- —
- Monthly cashflow
- —
- DSCR
- —
- Eligible?
- —
Short-term bridge; refi at stabilization.
Rent comps 4 comps
| Address | Beds | Baths | Sqft | Rent | $/sqft | DOM | Units | Dist |
|---|---|---|---|---|---|---|---|---|
| 2 N Market St Troy, OH | 3.0 | 1.0 | 2000 | $2,000 | $1.00 | 14d | 1 | 0.47mi |
| 5 N Market St Unit 5 1/2 Troy, OH | 3.0 | 2.0 | 1600 | $1,695 | $1.06 | 14d | 1 | 0.47mi |
| 1530 Williamsburg Pl Apt D Troy, OH | 3.0 | 1.5 | 1275 | $1,700 | $1.33 | 23d | 1 | 1.01mi |
| 580 Staunton Commons Dr Troy, OH | 2.0–3.0 | 1.0 | 957 | $1,395 | $1.46 | 2d | 2 | 1.12mi |
Listing history 11 events
-
2026-06-03statusdays on market $164,900 Pending 19 DOM
-
2026-06-02days on market $164,900 Active 18 DOM
-
2026-06-01days on market $164,900 Active 17 DOM
-
2026-05-31days on market $164,900 Active 16 DOM
-
2026-05-31days on market $164,900 Active 15 DOM
-
2026-05-20$164,900 Active 475-char remark
Show marketing remark (475 chars)
Discover an exceptional multi-family residence in Troy, offering spacious living and income potential. This property, with 3 bedrooms and 3 full bathrooms across 1,783 square feet, provides accessibility in its layout. Each unit includes a range and refrigerator. The 0.22-acre lot features a patio and porch, perfect for relaxation.New roof, new flooring, and toilets. Seller is willing to package for a portfolio deal, please contact agent for qualifying parcels and rents.
-
2026-05-15$164,900 Active
-
2008-12-05soldstatus $73,200
-
1996-08-02soldstatus $75,000
-
1991-05-30soldstatus $34,000
-
1987-09-24soldstatus $15,000
ⓘ Source: listings_history table (triggers on properties + properties_extension) + one-shot
backfill from property_details.listing_events for pre-trigger history.
Tax reassessment forecast OH · Partial reset (capped growth)
- Current annual tax
- $890 · $74/mo
- Projected year-2 tax
- $1,731 · $144/mo
- Expected delta
- +$841/yr (+$70/mo · 94.4%)
ⓘ Screening estimate from a state-policy table — verify with the county assessor before closing.
Climate risk First Street
- Flood 1/10 Low FEMA zone X (unshaded) · 0% chance over 30 yrs
- Wildfire 1/10 Low
- Heat 4/10 Moderate 7 d/yr ≥102°F today · 18 d/yr by 30 yrs out
- Wind 2/10 Low
- Air quality 3/10 Moderate 3 unhealthy d/yr today · 4 by 30 yrs out
Nearby sold comps map
Loading sold comps map…
Walkable amenities ~0.75 mi
Loading nearby amenities…
Taxation est. · year 1
- Rental income
- $26,976
- − Mortgage interest
- −$9,237
- − Property taxes
- −$890
- − Insurance
- −$824
- − Repairs & maintenance
- −$2,158
- − Management
- −$2,158
- − Depreciation
- −$4,797
- Taxable income
- $6,911
- Est. tax owed @ 24.0%
- −$1,659
- After-tax cash flow
- $7,560/yr
For passive investors: Depreciation is non-cash, so a rental often shows a tax loss while cash-flowing — sheltering income. Rental losses are passive: they offset passive income freely, and up to $25,000/yr can offset ordinary (W-2) income if you actively participate and your MAGI is under $100k (phasing out to $0 by $150k); unused losses carry forward. On sale, claimed depreciation is recaptured at up to 25%, and gains may owe capital-gains tax (a 1031 exchange can defer both). Figures are a year-1 estimate at your 24.0% rate — not tax advice; consult a CPA.
Schools (NCES district)
- District
- Troy City
- NCES district ID
- 3904492
- Math proficiency
- 61% ▼ -10.00%
- Reading proficiency
- 61% ▼ -7.00%
- Median HH income
- $52,012
- Composite
- 52.1/100
- National rank
- #1625
- State rank
- #271 of 656 in OH
Livability — Troy
- Score
- 73/100
- State rank
- #345
- US rank
- #5621
Category grades
Schools grade is shown separately in the Schools card above.
Census & demographics
- Census place
- Troy, OH
- County
- Miami County · 85,667 people
- City population
- 37,565
- Metro
- Dayton-Kettering, OH
- Population (ZIP)
- 37,565
- Household income
- $75,742
- Rent vs Own
- Severe rent burden
- 1134.0
Population outlook (Miami County) Hauer SSP2
- Today (2025)
- 107,816 people
- By 2030
- 108,896 · +1.0%
- By 2040
- 109,581 · +1.6%
- By 2050
- 108,110 · +0.3%
- By 2075
- 101,523 · -5.8%
- By 2100
- 85,787 · -20.4%
Race, ethnicity, and origin ACS 2023
- Neighborhood character
- Predominantly White (87%)
- Race & ethnicity
- White 87% Two or more races 6% Hispanic / Latino 4% Asian 3% Black 3%
- Common ancestry
- Lithuanian 4% Slovak 2% Iranian 2%
- Foreign-born
- 4% · Canada
- Languages at home
- 96% English-only · Other Asian/Pacific 2% Spanish 1% Other Indo-European 1%
Political lean MEDSL · Miami
- 2024 margin
- Solid R (+45.1) · D 27.0% · R 72.1%
- 2008→2024 swing
- -16.6pp toward R · 2008: -28.5pp · 2024: -45.1pp
- All cycles
- 2024: R+45.1 2020: R+44.3 2016: R+45.6 2012: R+35.6 2008: R+28.5
Not yet ingested
- Civics
- —
Market trends
- HPI YoY
- ▼ -158.93%
- Current HPI
- 211.5279
- Rent YoY
- ▲ 5.06%
- Metro
- Dayton-Kettering, OH
- State GDP YoY
- ▲ 1.98%
- F500 in state
- 48
Industry mix (Fortune 500 HQ in OH)
| Industry | F500 HQs | Revenue |
|---|---|---|
| Insurance | 3 | $145B |
|
||
| Industrial Machinery | 3 | $49B |
|
||
| Financial Services | 3 | $24B |
|
||
| Consumer Goods | 2 | $93B |
|
||
| Aerospace / Defense | 2 | $47B |
|
||
| Utilities | 2 | $33B |
|
||
Price history
+999.3% since first listed6 events — show timeline
- 2026-05-20 Listed $164,900 WRIST
- 2026-05-15 Listed $164,900 Dayton MLS
- 2008-12-05 Sold (Public Records) $73,200 Public Records
- 1996-08-02 Sold (Public Records) $75,000 Public Records
- 1991-05-30 Sold (Public Records) $34,000 Public Records
- 1987-09-24 Sold (Public Records) $15,000 Public Records
Property tax history
-0.5%/yrLatest (2025): $890 · -39.3% YoY. Source: county tax records.
Cash-flow waterfall
monthlySold comps — $/sqft
last 12 mo · ≤1 miLoading sold comps…