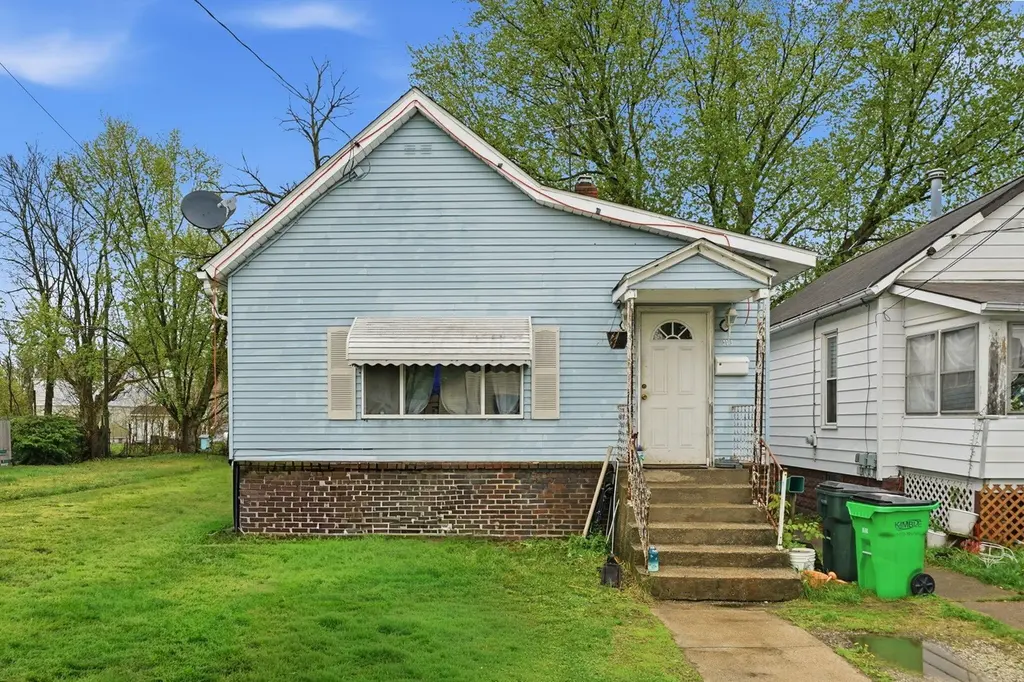
113 15th St NW
Barberton, OH 44203
$44,990B
1 bd · 1.0 ba ·
706 sqft ·
Built 1904
· SingleFamily
· Active
· 38 DOM
Cashflow @ list (25.0% down · 7.5%)
Estimated rent
$924/mo
Mortgage (P&I)
−$236
Tax + insurance
−$586
HOA
−$0
Vac / Maint / Mgmt
−$194
Net cashflow
$-92/mo
Annual
$-1,105/yr
Cap rate
16.12%
Cash-on-cash
35.09%
DSCR
2.56
1% rule
2.05%
Cash to close
$12,597
Investor read
- This is a 1-bed/1.0-bath single-family listed at $45k.
- At list price, monthly cash flow is $-92 ($-1k/yr) — negative.
- To cash-flow at today's rent, offer at most $29k (36.1% below list).
- Meets the 1% rule at list price ($924 rent vs $45k).
- It's been on market 38 days — a 3% lower offer ($44k) is reasonable based on typical stale-listing flexibility.
- Recommended offer: $29k (36.1% below list) — sets the bar for cash-flow.
- Local home prices are declining (-3.0%/yr); year-one equity from $312 of loan paydown is wiped out by about $1k of value loss. Plan a longer hold.
- Location reads 71/100 on livability (#428 in OH) — a middle-class / working-renter tenant base. Strengths: cost of living A+, housing A+, health & safety A+; Watch: crime C-, amenities F, commute F.
- Barberton City (suburban): math 47% / reading 51% proficiency, ranked #466 of 656 in OH (top 71%) — families likely to look elsewhere, expect single-tenant / working-renter base with shorter leases; 62% free/reduced lunch — lower-income household profile, screen leases tightly.
- Zoned schools: Barberton Primary School (math 56% / reading 51%, grade C, #834 of 1,584 statewide, top 53%, 762 students, 0% FRL); Barberton Middle School (math 45% / reading 50%, grade C-, #444 of 654 statewide, top 69%, 797 students, 72% FRL); Barberton High School (math 33% / reading 57%, grade D-, #468 of 781 statewide, top 60%, 1,220 students, 60% FRL) — zoned schools average 44% FRL vs 62% district-wide (18 pts lower); this property's tenant base skews higher-income than the district average.
- Watch-outs: property tax is 2.8% of price; flood insurance adds $460/mo; built in 1904 — expect roof / HVAC / electrical / plumbing capex.
- Market conditions: Rents rising fast (+5.9%/yr); 226 active listings in the ZIP; 10 comparable units currently listed for rent nearby; rentals at typical pace (median 26d on market — plan ~3-4 weeks tenant-placement turnaround); 1,114 units permitted in Summit County in 2024 (397 in 5+ unit buildings).
- Summit County population projected to shrink 6% by 2050 — rents likely to lag national; underwrite the cash flow, not the appreciation.
- 4 sale attempts since 20y ago; this cycle's ask has dropped $35k (44%) from the opening price — seller is motivated, your offer sets the floor, not the list.
- Climate carrying-cost: in FEMA flood zone AE (mandatory federal flood insurance) — expect insurance premiums to compound above CPI over the hold.
- Cap rate 16.1% vs local median 6.0% in Barberton — top-decile yield for the area; either an underpriced asset or a hidden risk that comps aren't pricing in. Stress-test before assuming the spread holds.
- This rent is only 17% of the median local income ($64k/yr) — well below the 30% rent-burden line; pricing power to push rent on renewal without tenant pushback.
Questions for listing agent
- What do current leases actually rent for vs. the listed asking? Can we see a recent rent roll and the last 12 months of T-12 income?
- It's been on market 38 days. Have you received any prior offers? Is the seller open to a 36% concession, seller financing, or rate buy-down credit?
- Built in 1904 — when were the roof, HVAC, electrical panel, plumbing, and water heater last replaced?
- Property tax is high relative to price — has the assessment been appealed recently, and will the sale trigger a re-assessment?
- What's the actual annual flood-insurance premium (NFIP or private), and is the property in a SFHA with mandatory coverage?
- Is there a deadline driving the sale (1031 exchange, divorce, estate, relocation)? That informs how much negotiation room exists.
- What's the average days-on-market for RENTAL listings here right now (not sales)? A rising rental-DOM trend means longer vacancies and softer asking-rent achievability than the comps imply.
- What's the recent tenant-quality profile in this submarket — average credit score on applications, eviction rate, late-payment / NSF rate, and stable-employment percentage? A property-management company in the area should have these aggregated.
CashFlowRE · CFR-W9Y79Q1AZZ4YZM
· Data 1 day ago
cashflowre.app · 2026-05-29