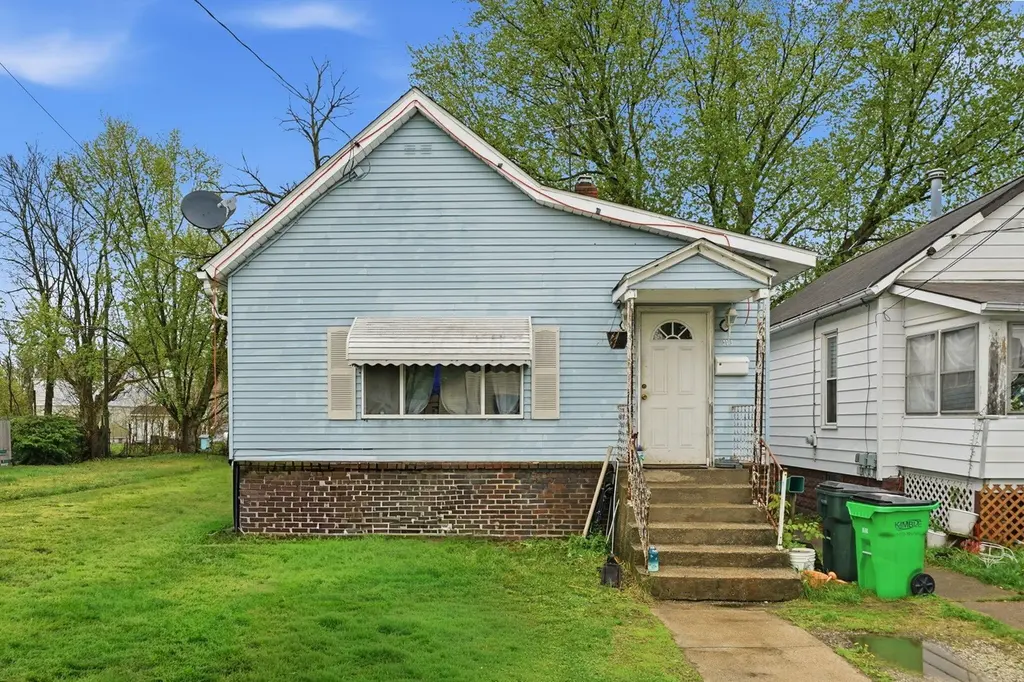
113 15th St NW · Barberton, OH
Flood risk 9/10 · Severe
- FEMA flood zone
- AE
- Chance of flooding over 30 yrs
- 0.99%
- Est. flood insurance / yr
- $2,026 – $9,024
Fire risk 1/10 · Minimal
- Est. fire insurance / yr
- $713 – $1,323
Heat risk 3/10 · Minor
- Hot days now (above 96°F)
- 7 days/yr
- Hot days in 30 yrs
- 17 days/yr
Wind risk 1/10 · Minimal
- Chance of severe wind over 30 yrs
- —
Air-quality risk 2/10 · Minimal
- Unhealthy air days now
- 0 days/yr
- Unhealthy air days in 30 yrs
- 1 days/yr
Risk factors via First Street. Map © Google.
Why this score? — see what drove the B grade
The composite is a weighted blend of 9 inputs, each scored 0–100. Each bar is that input's sub-score; the figure is the points it added to the 100-point composite (weight × sub-score).
- Cash flow +30.0/30.0
- 1% rule +10.0/10.0
- DSCR +10.0/10.0
- ARV discount +7.5/15.0
- Schools +4.1/10.0
- Rent growth +4.0/5.0
- Livability +3.6/5.0
- Condition / age +2.5/5.0
- Appreciation +0.0/10.0
$44,990
🖨 Deal sheet (PDF) 📄 Offer letter ✓ Due diligence
Listing remarks MLS
INVESTOR SPECIAL: 2-bed, 1-bath home in Barberton being sold strictly AS-IS. This 706 sq. ft. property features central air, a full basement, and detached parking. Perfect for a quick flip or rental portfolio addition. Seller will make no repairs--bring your contractor and your offers.
Key facts
- Full basement
- Detached parking
- Central air
Tags
Property features AI
Exterior
- Parking: 1 carport space
- Utilities: Public water; Public sewer
- Home design: Single family residence; One story; No common walls; Built in 1904
- Construction: Block and stone foundation
- Exterior features: Lot about 0.08 acres
Interior
- Bedrooms: 2 main-level bedrooms
- Bathrooms: 1 full bathroom
- Interior features: Full basement; Living area approximately 706
Neighborhood map
What this means for you Summary
Snapshot
- This is a 1-bed/1.0-bath single-family listed at $45k.
Deal economics
- At list price, monthly cash flow is $-92 ($-1k/yr) — negative.
- To cash-flow at today's rent, offer at most $29k (36.1% below list).
- Meets the 1% rule at list price ($924 rent vs $45k).
- Recommended offer: $29k (36.1% below list) — sets the bar for cash-flow.
- Cap rate 16.1% vs local median 6.0% in Barberton — top-decile yield for the area; either an underpriced asset or a hidden risk that comps aren't pricing in. Stress-test before assuming the spread holds.
Location & tenants
- Location reads 71/100 on livability (#428 in OH) — a middle-class / working-renter tenant base. Strengths: cost of living A+, housing A+, health & safety A+; Watch: crime C-, amenities F, commute F.
- Barberton City (suburban): math 47% / reading 51% proficiency, ranked #466 of 656 in OH (top 71%) — families likely to look elsewhere, expect single-tenant / working-renter base with shorter leases; 62% free/reduced lunch — lower-income household profile, screen leases tightly.
- Zoned schools: Barberton Primary School (math 56% / reading 51%, grade C, #834 of 1,584 statewide, top 53%, 762 students, 0% FRL); Barberton Middle School (math 45% / reading 50%, grade C-, #444 of 654 statewide, top 69%, 797 students, 72% FRL); Barberton High School (math 33% / reading 57%, grade D-, #468 of 781 statewide, top 60%, 1,220 students, 60% FRL) — zoned schools average 44% FRL vs 62% district-wide (18 pts lower); this property's tenant base skews higher-income than the district average.
- Market conditions: Rents rising fast (+5.9%/yr); 226 active listings in the ZIP; 10 comparable units currently listed for rent nearby; rentals at typical pace (median 25d on market — plan ~3-4 weeks tenant-placement turnaround); 1,114 units permitted in Summit County in 2024 (397 in 5+ unit buildings).
- This rent is only 17% of the median local income ($64k/yr) — well below the 30% rent-burden line; pricing power to push rent on renewal without tenant pushback.
Forward outlook
- Local home prices are declining (-3.0%/yr); year-one equity from $312 of loan paydown is wiped out by about $1k of value loss. Plan a longer hold.
- Summit County population projected to shrink 6% by 2050 — rents likely to lag national; underwrite the cash flow, not the appreciation.
Negotiation context
- It's been on market 38 days — a 3% lower offer ($44k) is reasonable based on typical stale-listing flexibility.
- 4 sale attempts since 20y ago; this cycle's ask has dropped $35k (44%) from the opening price — seller is motivated, your offer sets the floor, not the list.
Risks & watch-outs
- Watch-outs: property tax is 2.8% of price; flood insurance adds $460/mo; built in 1904 — expect roof / HVAC / electrical / plumbing capex.
- Climate carrying-cost: in FEMA flood zone AE (mandatory federal flood insurance) — expect insurance premiums to compound above CPI over the hold.
Questions for the listing agent
- What do current leases actually rent for vs. the listed asking? Can we see a recent rent roll and the last 12 months of T-12 income?
- It's been on market 38 days. Have you received any prior offers? Is the seller open to a 36% concession, seller financing, or rate buy-down credit?
- Built in 1904 — when were the roof, HVAC, electrical panel, plumbing, and water heater last replaced?
- Property tax is high relative to price — has the assessment been appealed recently, and will the sale trigger a re-assessment?
- What's the actual annual flood-insurance premium (NFIP or private), and is the property in a SFHA with mandatory coverage?
- Is there a deadline driving the sale (1031 exchange, divorce, estate, relocation)? That informs how much negotiation room exists.
- What's the average days-on-market for RENTAL listings here right now (not sales)? A rising rental-DOM trend means longer vacancies and softer asking-rent achievability than the comps imply.
- What's the recent tenant-quality profile in this submarket — average credit score on applications, eviction rate, late-payment / NSF rate, and stable-employment percentage? A property-management company in the area should have these aggregated.
- How much new for-sale + rental construction is in the pipeline within 1–3 miles? Heavy new supply typically softens prices + rents 12–24 months out; constrained supply supports both.
Investment metrics
- 1% rule
- 2.05% ✓
- Cap rate
- 16.12%
- Cash-on-cash
- 35.09%
- DSCR
- 2.56
- GRM
- 4.1
CMA / ARV
- ARV (median comp)
- $111,035
- List price
- $44,990
- Delta
- -59.48%
- Verdict
- UNDERPRICED
- Comps
- 20 within 1.0 mi
Show comp detail 2 sales within ~0.75 mi
| Address | Dist | Beds/Ba | Sqft | Sold | Price | $/sf | Match |
|---|---|---|---|---|---|---|---|
| 995 Perry Ave | 0.44mi | 2/1.0 (+1) | 610 (-14%) | 7mo | $55,000 | $90 | 46 |
| 211 29th St NW | 0.72mi | 2/1.0 (+1) | 748 (+6%) | 23mo | $50,000 | $67 | 32 |
Match score weights: distance 35% · size 25% · config 20% · recency 20%. Top-matched comps best support the ARV.
Projected returns pro-forma
-3.0% appreciation · 5.86% rent growth · sell at horizon
- IRR
- -21.5%
- Equity multiple
- 0.20×
- Total profit
- $-10,092
- Equity at exit
- $6,708
- IRR
- -2.7%
- Equity multiple
- 0.75×
- Total profit
- $-3,109
- Equity at exit
- $3,890
Cash invested: $12,597 (down + closing). Projections, not guarantees.
Landlord ↔ Tenant lean methodology
- Overall (STATE)
- 73 Landlord-Friendly
- State Ohio
- 73 Landlord-Friendly · R+6
- County
- — inherits STATE
- City
- — inherits STATE
ZIP-level market 44203
- Rents YoY
- 5.9%
- Active inventory
- 226
- Price-to-rent
- 4.1×
Monthly cashflow live
- Estimated rent
- $924 high interval (Pro) →
- Mortgage (P&I)
- −$236
- Tax from tax record
- −$107 /mo · $1,278/yr
- Insurance
- −$19
- Flood insurance flood zone
- −$460 /mo · $5,525/yr
- HOA
- −$0
- Vacancy / Maint / Mgmt
- −$194
- Net cashflow
- $-92
Break-even live
Sensitivity live
| Price | -10% $-67 | -5% $-79 | +0% $-92 | +5% $-105 | +10% $-118 |
|---|---|---|---|---|---|
| Rent | -10% $-165 | -5% $-129 | +0% $-92 | +5% $-56 | +10% $-19 |
| Rate | -1.0pp $-69 | -0.5pp $-81 | base $-92 | +0.5pp $-104 | +1.0pp $-116 |
UW: 25.0% down · 7.5% · 30yr · 1.5% tax · 5.0% vac · 8.0% maint · 8.0% mgmt
Financing live
Cash to close
- Down payment
- $11,248
- Closing costs
- $1,350
- Reserves months
- —
- Total cash needed
- —
Loan-product check · same deal, 3 products live
Conventional
25% down · 7.5% · 30yr
- Down + closing
- —
- Monthly P&I
- —
- Monthly cashflow
- —
- DSCR
- —
- Eligible?
- —
Personal DTI + credit; lowest rate.
DSCR
20% down · 8.5% · 30yr
- Down + closing
- —
- Monthly P&I
- —
- Monthly cashflow
- —
- DSCR
- —
- Eligible?
- —
No personal income docs; deal must DSCR.
Hard money
10% down · 12.0% · 12mo
- Down + closing
- —
- Monthly P&I
- —
- Monthly cashflow
- —
- DSCR
- —
- Eligible?
- —
Short-term bridge; refi at stabilization.
Rent comps 10 comps
| Address | Beds | Baths | Sqft | Rent | $/sqft | DOM | Units | Dist |
|---|---|---|---|---|---|---|---|---|
| 288 5th St NW Unit 288 1/2 Barberton, OH | 1.0 | 1.0 | 720 | $750 | $1.04 | 25d | 1 | 0.63mi |
| 1270 South Ave Barberton, OH | 1.0–2.0 | 1.0–1.5 | 1012 | $989 | $0.98 | 15d | 1 | 0.81mi |
| 3839-3859 Long Dr Norton, OH | 1.0 | 1.0 | 750 | $1,141 | $1.52 | 16d | 2 | 1.16mi |
| 74 1st St SE Unit 16 Barberton, OH | 1.0 | 1.0 | 600 | $795 | $1.32 | 25d | 1 | 1.27mi |
| 82 1st St SE Barberton, OH | 1.0 | 1.0 | 600 | $795 | $1.32 | 25d | 1 | 1.29mi |
| 82 1st St SE Unit 11 Barberton, OH | 1.0 | 1.0 | 600 | $800 | $1.33 | 25d | 1 | 1.29mi |
| 3343 Columbia Woods Dr Norton, OH | 1.0–2.0 | 1.0–2.0 | 900 | $1,425 | $1.58 | 4d | 9 | 1.34mi |
| 105 2nd St SE Barberton, OH | 2.0 | 1.0 | 728 | $895 | $1.23 | 45d | 1 | 1.48mi |
| 105 2nd St SE Unit 101-J Barberton, OH | 1.0 | 1.0 | 612 | $825 | $1.35 | 45d | 1 | 1.48mi |
| 105 2nd St SE Barberton, OH | 1.0 | 1.0 | 612 | $825 | $1.35 | 16d | 1 | 1.48mi |
Listing history 21 events
-
2026-06-21days on market $44,990 Active 38 DOM
-
2026-06-18days on market $44,990 Active 35 DOM
-
2026-06-17days on market $44,990 Active 34 DOM
-
2026-06-16days on market $44,990 Active 33 DOM
-
2026-06-15days on market $44,990 Active 32 DOM
-
2026-06-14pricedays on market $44,990 Active 30 DOM
-
2026-06-10days on market $49,990 Active 27 DOM
-
2026-06-09days on market $49,990 Active 26 DOM
-
2026-06-08days on market $49,990 Active 25 DOM
-
2026-06-07pricedays on market $49,990 Active 24 DOM
-
2026-06-03days on market $59,990 Active 20 DOM
-
2026-06-02days on market $59,990 Active 19 DOM
-
2026-06-01days on market $59,990 Active 18 DOM
-
2026-05-31days on market $59,990 Active 17 DOM
-
2026-05-31days on market $59,990 Active 16 DOM
-
2026-05-14$79,990 Active 286-char remark
Show marketing remark (286 chars)
INVESTOR SPECIAL: 2-bed, 1-bath home in Barberton being sold strictly AS-IS. This 706 sq. ft. property features central air, a full basement, and detached parking. Perfect for a quick flip or rental portfolio addition. Seller will make no repairs--bring your contractor and your offers.
-
2008-02-23historical
-
2007-06-25$46,000
-
2007-05-31historical
-
2006-10-28$49,900
ⓘ Source: listings_history table (triggers on properties + properties_extension) + one-shot
backfill from property_details.listing_events for pre-trigger history.
Tax reassessment forecast OH · Partial reset (capped growth)
- Current annual tax
- $1,278 · $107/mo
- Projected year-2 tax
- $1,278 · $107/mo
- Expected delta
- $0/yr ($0/mo · 0.0%)
ⓘ Screening estimate from a state-policy table — verify with the county assessor before closing.
Climate risk First Street
- Flood 9/10 Extreme FEMA zone AE · 99% chance over 30 yrs
- Wildfire 1/10 Low
- Heat 3/10 Moderate 7 d/yr ≥96°F today · 17 d/yr by 30 yrs out
- Wind 1/10 Low
- Air quality 2/10 Low 0 unhealthy d/yr today · 1 by 30 yrs out
Nearby sold comps map
Loading sold comps map…
Walkable amenities ~0.75 mi
Loading nearby amenities…
Taxation est. · year 1
- Rental income
- $11,082
- − Mortgage interest
- −$2,520
- − Property taxes
- −$1,278
- − Insurance
- −$5,750
- − Repairs & maintenance
- −$887
- − Management
- −$887
- − Depreciation
- −$1,309
- Taxable loss
- −$1,548
- Est. tax savings @ 24.0%
- +$372
- After-tax cash flow
- $-733/yr
For passive investors: Depreciation is non-cash, so a rental often shows a tax loss while cash-flowing — sheltering income. Rental losses are passive: they offset passive income freely, and up to $25,000/yr can offset ordinary (W-2) income if you actively participate and your MAGI is under $100k (phasing out to $0 by $150k); unused losses carry forward. On sale, claimed depreciation is recaptured at up to 25%, and gains may owe capital-gains tax (a 1031 exchange can defer both). Figures are a year-1 estimate at your 24.0% rate — not tax advice; consult a CPA.
Schools (NCES district)
- District
- Barberton City
- NCES district ID
- 3904353
- Math proficiency
- 47% ▼ -9.00%
- Reading proficiency
- 51% ▼ -9.00%
- Median HH income
- $37,660
- Composite
- 40.77/100
- National rank
- #3646
- State rank
- #466 of 656 in OH
Livability — Barberton
- Score
- 71/100
- State rank
- #428
- US rank
- #7016
Category grades
Schools grade is shown separately in the Schools card above.
Census & demographics
- Census place
- Barberton, OH
- County
- Summit County · 440,783 people
- City population
- 38,701
- Metro
- Akron, OH
- Population (ZIP)
- 38,701
- Household income
- $63,759
- Rent vs Own
- Severe rent burden
- 805.0
Population outlook (Summit County) Hauer SSP2
- Today (2025)
- 546,583 people
- By 2030
- 544,028 · -0.5%
- By 2040
- 531,363 · -2.8%
- By 2050
- 514,923 · -5.8%
- By 2075
- 481,765 · -11.9%
- By 2100
- 432,265 · -20.9%
Race, ethnicity, and origin ACS 2023
- Neighborhood character
- Predominantly White (86%)
- Race & ethnicity
- White 86% Black 7% Two or more races 5% Hispanic / Latino 1%
- Common ancestry
- Romanian 3% Slovak 2% Italian 1%
- Foreign-born
- 2% · Canada
- Languages at home
- 97% English-only · Russian/Polish/Slavic 1% Spanish 1%
Political lean MEDSL · Summit
- 2024 margin
- Lean D (+7.0) · D 53.0% · R 46.0%
- 2008→2024 swing
- -9.6pp toward R · 2008: 16.6pp · 2024: 7.0pp
- All cycles
- 2024: D+7.0 2020: D+9.6 2016: D+8.2 2012: D+14.8 2008: D+16.6
Not yet ingested
- Civics
- —
Market trends
- HPI YoY
- ▼ -224.82%
- Current HPI
- 199.8143
- Rent YoY
- ▲ 5.86%
- Metro
- Akron, OH
- State GDP YoY
- ▲ 1.98%
- F500 in state
- 48
Industry mix (Fortune 500 HQ in OH)
| Industry | F500 HQs | Revenue |
|---|---|---|
| Insurance | 3 | $145B |
|
||
| Industrial Machinery | 3 | $49B |
|
||
| Financial Services | 3 | $24B |
|
||
| Consumer Goods | 2 | $93B |
|
||
| Aerospace / Defense | 2 | $47B |
|
||
| Utilities | 2 | $33B |
|
||
Price history
-9.8% since first listed14 events — show timeline
- 2026-06-11 Price Changed $44,990 MLSNOW
- 2026-06-11 Price Changed $44,990 CBRMLS
- 2026-06-04 Price Changed $49,990 MLSNOW
- 2026-06-04 Price Changed $49,990 CBRMLS
- 2026-05-28 Price Changed $59,990 MLSNOW
- 2026-05-28 Price Changed $59,990 CBRMLS
- 2026-05-21 Price Changed $69,990 MLSNOW
- 2026-05-21 Price Changed $69,990 CBRMLS
- 2026-05-14 Listed $79,990 CBRMLS
- 2026-05-14 Listed $79,990 MLSNOW
- 2008-02-23 Listing Removed — MLSNOW
- 2007-06-25 Listed $46,000 MLSNOW
- 2007-05-31 Listing Removed — MLSNOW
- 2006-10-28 Listed $49,900 MLSNOW
Property tax history
+14.6%/yrLatest (2025): $1,278 · -2.1% YoY. Source: county tax records.
Cash-flow waterfall
monthlySold comps — $/sqft
last 12 mo · ≤1 miLoading sold comps…