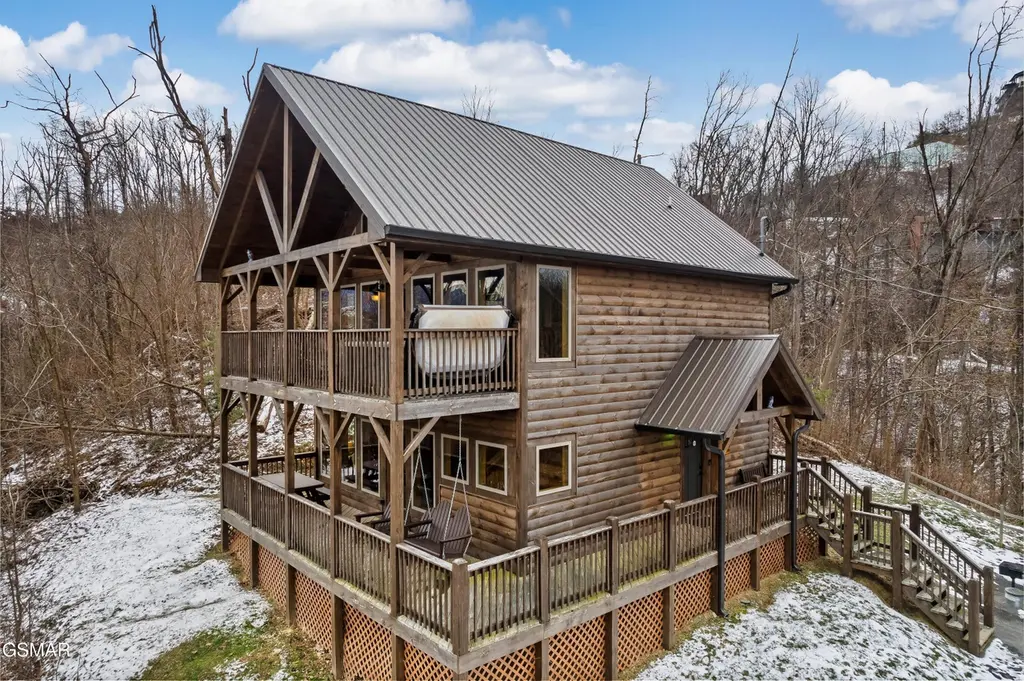
634 Wiley Oakley Dr
Gatlinburg, TN 37738
$619,000F
2 bd · 3.0 ba ·
1,456 sqft ·
Built 2020
· SingleFamily
· Pending
· 4 DOM
Cashflow @ list (25.0% down · 7.5%)
Estimated rent
$4,995/mo
Mortgage (P&I)
−$3,246
Tax + insurance
−$461
HOA
−$35
Vac / Maint / Mgmt
−$1,049
Net cashflow
$204/mo
Annual
$2,449/yr
Cap rate
6.69%
Cash-on-cash
1.41%
DSCR
1.06
1% rule
0.81%
Cash to close
$173,320
Investor read
- This is a 2-bed/3.0-bath single-family listed at $619k.
- At list price, monthly cash flow is $204 ($2k/yr) — positive.
- The deal already cash-flows at list — no discount required.
- To meet the 1% rule (rent ≥ 1% of price), the offer needs to be $500k (19.3% below list).
- Only 4 days on market — expect competitive offers; lowballing is unlikely to land.
- Recommended offer: $500k (19.3% below list) — sets the bar for 1% rule.
- Local home prices are declining (-3.0%/yr); year-one equity from $4k of loan paydown is wiped out by about $19k of value loss. Plan a longer hold.
- Location reads 73/100 on livability (#27 in TN) — a middle-class / working-renter tenant base. Strengths: commute A+, cost of living A; Watch: crime F, amenities F, employment D-.
- Sevier County (rural): math 31% / reading 28% proficiency, ranked #62 of 139 in TN (top 45%) — low school quality limits family demand, transient renter base, plan for 1-2y turnover.
- Zoned schools: New Center Elementary (math 32% / reading 28%, grade F, #415 of 952 statewide, top 44%, 855 students, 0% FRL); Seymour Junior High (math 40% / reading 30%, grade F, #65 of 333 statewide, top 20%, 766 students, 0% FRL); Sevier County High School (math 20% / reading 38%, grade F, #92 of 332 statewide, top 28%, 1,248 students, 0% FRL) — zoned schools average 0% FRL vs 52% district-wide (52 pts lower); this property's tenant base skews higher-income than the district average.
- Market conditions: 700 active listings in the ZIP; 1 comparable units currently listed for rent nearby; 1,594 units permitted in Sevier County in 2024 (456 in 5+ unit buildings).
- Sevier County population projected at +22% by 2050 — long-run rental-demand tailwind backs the buy-and-hold thesis.
- 6 sale attempts since 17y ago with the ask held roughly flat each time — persistent listings suggest the price (not the market) is what's stuck; bring a comps-based counter.
- Climate carrying-cost: moderate wildfire risk — expect insurance premiums to compound above CPI over the hold.
- Cap rate 6.7% vs local median 1.2% in Gatlinburg — top-decile yield for the area; either an underpriced asset or a hidden risk that comps aren't pricing in. Stress-test before assuming the spread holds.
Questions for listing agent
- What does the HOA fee cover, when was the last increase, and are there any pending special assessments or reserve-fund shortfalls?
- Is there a deadline driving the sale (1031 exchange, divorce, estate, relocation)? That informs how much negotiation room exists.
- Schools are D-rated, which usually means shorter tenancies and higher turnover. Who's the typical renter profile here, and what's been the actual vacancy rate?
- Crime grade is F in this area — have there been break-ins, vandalism, or insurance claims at this property in the last 3 years? What carrier currently insures it and at what premium?
- The area grade is low — what's the realistic commute time and amenity access for the typical tenant pool here? Any planned neighborhood developments (good or bad) we should know about?
- What's the average days-on-market for RENTAL listings here right now (not sales)? A rising rental-DOM trend means longer vacancies and softer asking-rent achievability than the comps imply.
- What's the recent tenant-quality profile in this submarket — average credit score on applications, eviction rate, late-payment / NSF rate, and stable-employment percentage? A property-management company in the area should have these aggregated.
- How much new for-sale + rental construction is in the pipeline within 1–3 miles? Heavy new supply typically softens prices + rents 12–24 months out; constrained supply supports both.
CashFlowRE · CFR-WC1T2W2V0MN40C
· Data 3 weeks ago
cashflowre.app · 2026-05-29