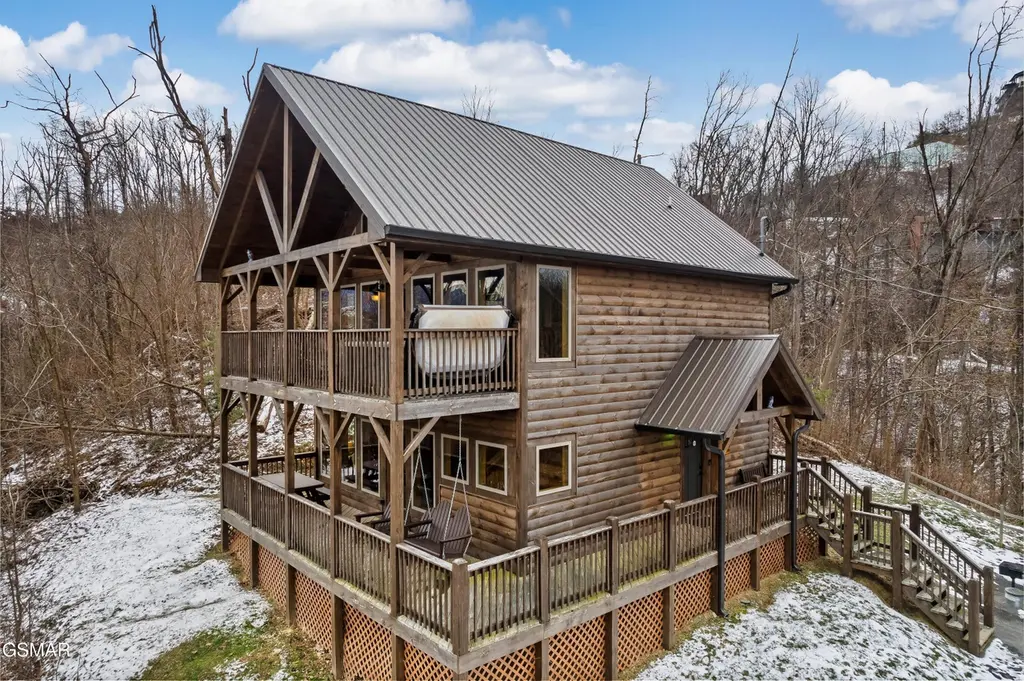
634 Wiley Oakley Dr · Gatlinburg, TN
Flood risk 1/10 · Minimal
- FEMA flood zone
- X (unshaded)
- Chance of flooding over 30 yrs
- 0.0%
- Est. flood insurance / yr
- $507 – $1,088
Fire risk 5/10 · Moderate
- Est. fire insurance / yr
- $949 – $1,763
Heat risk 4/10 · Minor
- Hot days now (above 98°F)
- 7 days/yr
- Hot days in 30 yrs
- 19 days/yr
Wind risk 2/10 · Minimal
- Chance of severe wind over 30 yrs
- —
Air-quality risk 4/10 · Minor
- Unhealthy air days now
- 5 days/yr
- Unhealthy air days in 30 yrs
- 5 days/yr
Risk factors via First Street. Map © Google.
Why this score? — see what drove the F grade
The composite is a weighted blend of 9 inputs, each scored 0–100. Each bar is that input's sub-score; the figure is the points it added to the 100-point composite (weight × sub-score).
- Cash flow +15.1/30.0
- DSCR +4.6/10.0
- Livability +3.7/5.0
- 1% rule +3.1/10.0
- Rent growth +2.5/5.0
- Schools +2.5/10.0
- Condition / age +2.5/5.0
- ARV discount +0.0/15.0
- Appreciation +0.0/10.0
$619,000
🖨 Deal sheet (PDF) 📄 Offer letter ✓ Due diligence
Listing remarks
Beautiful 2-bedroom cabin located in highly sought-after Chalet Village, built in 2019 and designed for the perfect Smoky Mountain getaway. Offering modern finishes, a comfortable layout, and the ideal blend of mountain charm and contemporary style, this property is perfect as a short-term rental investment, vacation home, or personal retreat. Enjoy the convenience of a newer build with low-maintenance living while being just minutes from downtown Gatlinburg, hiking, attractions, dining, and all the Smokies have to offer. Whether you're looking to expand your investment portfolio or own your own mountain escape, this cabin is a fantastic opportunity in one of the area's most desirable commu
Key facts
- Newer build
- Vacation home
- Personal retreat
Tags
Property features AI
Finance
- HOA & community: Homeowners association with an annual fee of $425 (about $35.42/month)
Exterior
- Utilities: Public water; Septic tank sewer
- Home design: Single-family residence; Two-story
- Construction: Approximately 1,456 finished square feet
- Exterior features: Lot in R-1 zoning; Lot dimensions approximately 105 x 209.79 (irregular)
Interior
- Bathrooms: One full bathroom; One half bathroom
- Interior features: Two gas-log fireplaces
Neighborhood map
What this means for you Summary
Snapshot
- This is a 2-bed/3.0-bath single-family listed at $619k.
Deal economics
- At list price, monthly cash flow is $204 ($2k/yr) — positive.
- The deal already cash-flows at list — no discount required.
- To meet the 1% rule (rent ≥ 1% of price), the offer needs to be $500k (19.3% below list).
- Recommended offer: $500k (19.3% below list) — sets the bar for 1% rule.
- Cap rate 6.7% vs local median 1.2% in Gatlinburg — top-decile yield for the area; either an underpriced asset or a hidden risk that comps aren't pricing in. Stress-test before assuming the spread holds.
Location & tenants
- Location reads 73/100 on livability (#27 in TN) — a middle-class / working-renter tenant base. Strengths: commute A+, cost of living A; Watch: crime F, amenities F, employment D-.
- Sevier County (rural): math 31% / reading 28% proficiency, ranked #62 of 139 in TN (top 45%) — low school quality limits family demand, transient renter base, plan for 1-2y turnover.
- Zoned schools: New Center Elementary (math 32% / reading 28%, grade F, #415 of 952 statewide, top 44%, 855 students, 0% FRL); Seymour Junior High (math 40% / reading 30%, grade F, #65 of 333 statewide, top 20%, 766 students, 0% FRL); Sevier County High School (math 20% / reading 38%, grade F, #92 of 332 statewide, top 28%, 1,248 students, 0% FRL) — zoned schools average 0% FRL vs 52% district-wide (52 pts lower); this property's tenant base skews higher-income than the district average.
- Market conditions: 700 active listings in the ZIP; 1 comparable units currently listed for rent nearby; 1,594 units permitted in Sevier County in 2024 (456 in 5+ unit buildings).
Forward outlook
- Local home prices are declining (-3.0%/yr); year-one equity from $4k of loan paydown is wiped out by about $19k of value loss. Plan a longer hold.
- Sevier County population projected at +22% by 2050 — long-run rental-demand tailwind backs the buy-and-hold thesis.
Negotiation context
- Only 4 days on market — expect competitive offers; lowballing is unlikely to land.
- 6 sale attempts since 17y ago with the ask held roughly flat each time — persistent listings suggest the price (not the market) is what's stuck; bring a comps-based counter.
Risks & watch-outs
- Climate carrying-cost: moderate wildfire risk — expect insurance premiums to compound above CPI over the hold.
Questions for the listing agent
- What does the HOA fee cover, when was the last increase, and are there any pending special assessments or reserve-fund shortfalls?
- Is there a deadline driving the sale (1031 exchange, divorce, estate, relocation)? That informs how much negotiation room exists.
- Schools are D-rated, which usually means shorter tenancies and higher turnover. Who's the typical renter profile here, and what's been the actual vacancy rate?
- Crime grade is F in this area — have there been break-ins, vandalism, or insurance claims at this property in the last 3 years? What carrier currently insures it and at what premium?
- The area grade is low — what's the realistic commute time and amenity access for the typical tenant pool here? Any planned neighborhood developments (good or bad) we should know about?
- What's the average days-on-market for RENTAL listings here right now (not sales)? A rising rental-DOM trend means longer vacancies and softer asking-rent achievability than the comps imply.
- What's the recent tenant-quality profile in this submarket — average credit score on applications, eviction rate, late-payment / NSF rate, and stable-employment percentage? A property-management company in the area should have these aggregated.
- How much new for-sale + rental construction is in the pipeline within 1–3 miles? Heavy new supply typically softens prices + rents 12–24 months out; constrained supply supports both.
Investment metrics
- 1% rule
- 0.81% ✗
- Cap rate
- 6.69%
- Cash-on-cash
- 1.41%
- DSCR
- 1.06
- GRM
- 10.3
CMA / ARV
- ARV (on-the-fly)
- $503,776
- Comps found
- 5
Show comp detail 5 sales within ~0.75 mi
| Address | Dist | Beds/Ba | Sqft | Sold | Price | $/sf | Match |
|---|---|---|---|---|---|---|---|
| 609 Sunset Ln | 0.15mi | 3/2.0 (+1) | 1,344 (-8%) | 6mo | $465,000 | $346 | 66 |
| 1108 Circle Pt | 0.61mi | 2/2.5 | 1,520 (+4%) | 10mo | $450,000 | $296 | 54 |
| 523 Greenbriar Ln | 0.44mi | 2/2.0 | 1,325 (-9%) | 10mo | $750,000 | $566 | 52 |
| 1020 Deep Hollow Rd | 0.39mi | 1/1.5 (-1) | 1,265 (-13%) | 6mo | $462,000 | $365 | 44 |
| 619 Jefferson Rd | 0.58mi | 2/2.0 | 1,635 (+12%) | 11mo | $286,550 | $175 | 39 |
Match score weights: distance 35% · size 25% · config 20% · recency 20%. Top-matched comps best support the ARV.
Projected returns pro-forma
-3.0% appreciation · 3.0% rent growth · sell at horizon
- IRR
- -14.1%
- Equity multiple
- 0.49×
- Total profit
- $-87,558
- Equity at exit
- $92,295
- IRR
- -5.4%
- Equity multiple
- 0.65×
- Total profit
- $-60,536
- Equity at exit
- $53,520
Cash invested: $173,320 (down + closing). Projections, not guarantees.
Landlord ↔ Tenant lean methodology
- Overall (STATE)
- 87 Strongly Landlord-Friendly
- State Tennessee
- 87 Strongly Landlord-Friendly · R+13
- County
- — inherits STATE
- City
- — inherits STATE
ZIP-level market 37738
- Home prices YoY
- -28.5%
- Active inventory
- 700
- Price-to-rent
- 10.3×
Monthly cashflow live
- Estimated rent
- $4,995 medium interval (Pro) →
- Mortgage (P&I)
- −$3,246
- Tax from tax record
- −$203 /mo · $2,435/yr
- Insurance
- −$258
- HOA
- −$35
- Vacancy / Maint / Mgmt
- −$1,049
- Net cashflow
- $204
Break-even live
Sensitivity live
| Price | -10% $555 | -5% $379 | +0% $204 | +5% $29 | +10% $-146 |
|---|---|---|---|---|---|
| Rent | -10% $-190 | -5% $7 | +0% $204 | +5% $401 | +10% $599 |
| Rate | -1.0pp $516 | -0.5pp $362 | base $204 | +0.5pp $44 | +1.0pp $-119 |
UW: 25.0% down · 7.5% · 30yr · 1.5% tax · 5.0% vac · 8.0% maint · 8.0% mgmt
Financing live
Cash to close
- Down payment
- $154,750
- Closing costs
- $18,570
- Reserves months
- —
- Total cash needed
- —
Loan-product check · same deal, 3 products live
Conventional
25% down · 7.5% · 30yr
- Down + closing
- —
- Monthly P&I
- —
- Monthly cashflow
- —
- DSCR
- —
- Eligible?
- —
Personal DTI + credit; lowest rate.
DSCR
20% down · 8.5% · 30yr
- Down + closing
- —
- Monthly P&I
- —
- Monthly cashflow
- —
- DSCR
- —
- Eligible?
- —
No personal income docs; deal must DSCR.
Hard money
10% down · 12.0% · 12mo
- Down + closing
- —
- Monthly P&I
- —
- Monthly cashflow
- —
- DSCR
- —
- Eligible?
- —
Short-term bridge; refi at stabilization.
Rent comps 1 comps
| Address | Beds | Baths | Sqft | Rent | $/sqft | DOM | Units | Dist |
|---|---|---|---|---|---|---|---|---|
| 327 E Holly Ridge Rd Gatlinburg, TN | 3.0 | 3.0 | 1657 | $4,995 | $3.01 | 25d | 1 | 1.36mi |
HOA detail
- Monthly dues
- $35 · $420/yr
Listing history 19 events
-
2026-05-17$619,000 Active
-
2025-03-04price $794,000
-
2025-01-20$799,000 Active
-
2021-07-14soldstatus $650,000
-
2021-07-01soldstatus $650,000
-
2018-12-11soldstatus $60,000
-
2018-12-10soldstatus $60,000
-
2018-12-10soldstatus $60,000 Closed
-
2018-11-07price $69,500
-
2018-11-04historical Pending - Continue to Show - Inspection
-
2018-06-14$99,500 Active
-
2018-06-14price $89,500
-
2010-11-01soldstatus $159,900
-
2010-10-28soldstatus $159,900
-
2010-09-01$169,900
-
2010-06-21$169,900
-
2009-09-21$189,900
-
2004-10-06soldstatus $220,000
-
2002-09-30soldstatus $187,500
ⓘ Source: listings_history table (triggers on properties + properties_extension) + one-shot
backfill from property_details.listing_events for pre-trigger history.
Tax reassessment forecast TN · Resets to sale price
- Current annual tax
- $2,435 · $203/mo
- Projected year-2 tax
- $4,395 · $366/mo
- Expected delta
- +$1,960/yr (+$163/mo · 80.5%)
ⓘ Screening estimate from a state-policy table — verify with the county assessor before closing.
Climate risk First Street
- Flood 1/10 Low FEMA zone X (unshaded) · 0% chance over 30 yrs
- Wildfire 5/10 Major
- Heat 4/10 Moderate 7 d/yr ≥98°F today · 19 d/yr by 30 yrs out
- Wind 2/10 Low
- Air quality 4/10 Moderate 5 unhealthy d/yr today · 5 by 30 yrs out
Nearby sold comps map
Loading sold comps map…
Walkable amenities ~0.75 mi
Loading nearby amenities…
Taxation est. · year 1
- Rental income
- $59,940
- − Mortgage interest
- −$34,674
- − Property taxes
- −$2,435
- − Insurance
- −$3,095
- − Repairs & maintenance
- −$4,795
- − Management
- −$4,795
- − HOA
- −$420
- − Depreciation
- −$18,007
- Taxable loss
- −$8,281
- Est. tax savings @ 24.0%
- +$1,988
- After-tax cash flow
- $4,437/yr
For passive investors: Depreciation is non-cash, so a rental often shows a tax loss while cash-flowing — sheltering income. Rental losses are passive: they offset passive income freely, and up to $25,000/yr can offset ordinary (W-2) income if you actively participate and your MAGI is under $100k (phasing out to $0 by $150k); unused losses carry forward. On sale, claimed depreciation is recaptured at up to 25%, and gains may owe capital-gains tax (a 1031 exchange can defer both). Figures are a year-1 estimate at your 24.0% rate — not tax advice; consult a CPA.
Schools (NCES district)
- District
- Sevier County
- NCES district ID
- 4703780
- Math proficiency
- 31% ▼ -6.00%
- Reading proficiency
- 28% ▼ -4.00%
- Median HH income
- $42,730
- Composite
- 25.12/100
- National rank
- #7527
- State rank
- #62 of 139 in TN
Livability — Gatlinburg
- Score
- 73/100
- State rank
- #27
- US rank
- #5524
Category grades
Schools grade is shown separately in the Schools card above.
Census & demographics
- Population (ZIP)
- 5,269
Population outlook (Sevier County) Hauer SSP2
- Today (2025)
- 107,903 people
- By 2030
- 113,633 · +5.3%
- By 2040
- 123,969 · +14.9%
- By 2050
- 132,123 · +22.4%
- By 2075
- 148,524 · +37.6%
- By 2100
- 153,436 · +42.2%
Race, ethnicity, and origin ACS 2023
- Neighborhood character
- Predominantly White (81%)
- Race & ethnicity
- White 81% Hispanic / Latino 12% Two or more races 4% Black 3% Asian 3%
- Hispanic origin (detail)
- Mexican 2%
- Common ancestry
- Slovak 6% Serbian 5% Romanian 3%
- Foreign-born
- 12% · Canada, China
- Languages at home
- 86% English-only · Spanish 10% Other Indo-European 2% Chinese 1%
Political lean MEDSL · Sevier
- 2024 margin
- Solid R (+61.1) · D 18.9% · R 80.1% · Other 1.0%
- 2008→2024 swing
- -13.1pp toward R · 2008: -48.1pp · 2024: -61.1pp
- All cycles
- 2024: R+61.1 2020: R+57.6 2016: R+61.7 2012: R+54.8 2008: R+48.1
Not yet ingested
- Civics
- —
Market trends
- HPI YoY
- ▼ -118.02%
- Current HPI
- 296.203
- Rent YoY
- —
- Metro
- —
- State GDP YoY
- ▲ 2.78%
- F500 in state
- 22
Industry mix (Fortune 500 HQ in TN)
| Industry | F500 HQs | Revenue |
|---|---|---|
| Healthcare | 3 | $91B |
|
||
| Retail | 3 | $72B |
|
||
| Transportation / Logistics | 1 | $88B |
|
||
| Paper / Packaging | 1 | $19B |
|
||
| Insurance | 1 | $13B |
|
||
| Energy | 1 | $12B |
|
||
Price history
+230.1% since first listed19 events — show timeline
- 2026-05-17 Listed $619,000 GSMAR
- 2025-03-04 Price Changed $794,000 GSMAR
- 2025-01-20 Listed $799,000 GSMAR
- 2021-07-14 Sold (Public Records) $650,000 Public Records
- 2021-07-01 Sold (MLS) $650,000 GSMAR
- 2018-12-11 Sold (Public Records) $60,000 Public Records
- 2018-12-10 Sold (MLS) $60,000 Knoxville MLS
- 2018-12-10 Sold (MLS) $60,000 GSMAR
- 2018-11-07 Price Changed $69,500 Knoxville MLS
- 2018-11-04 Contingent — Knoxville MLS
- 2018-06-14 Listed $99,500 Knoxville MLS
- 2018-06-14 Price Changed $89,500 Knoxville MLS
- 2010-11-01 Sold (Public Records) $159,900 Public Records
- 2010-10-28 Sold (MLS) $159,900 Knoxville MLS
- 2010-09-01 Listed $169,900 Knoxville MLS
- 2010-06-21 Listed $169,900 Knoxville MLS
- 2009-09-21 Listed $189,900 Knoxville MLS
- 2004-10-06 Sold (Public Records) $220,000 Public Records
- 2002-09-30 Sold (Public Records) $187,500 Public Records
Property tax history
+8.5%/yrLatest (2025): $2,435 · +0.0% YoY. Source: county tax records.
Cash-flow waterfall
monthlySold comps — $/sqft
last 12 mo · ≤1 miLoading sold comps…