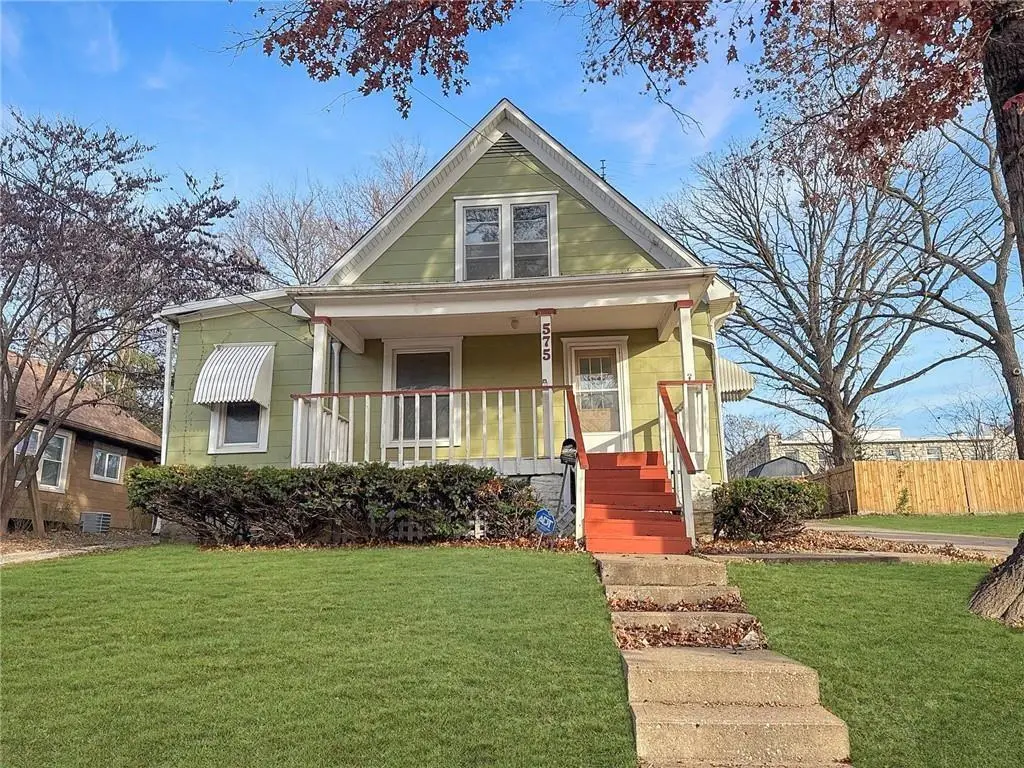
575 S Crescent Ave
Independence, MO 64053
$185,000D
3 bd · 2.0 ba ·
1,412 sqft ·
Built 1920
· SingleFamily
· Pending
· 10 DOM
Cashflow @ list (25.0% down · 7.5%)
Estimated rent
$1,451/mo
Mortgage (P&I)
−$970
Tax + insurance
−$177
HOA
−$0
Vac / Maint / Mgmt
−$305
Net cashflow
$-1/mo
Annual
$-10/yr
Cap rate
6.29%
Cash-on-cash
-0.02%
DSCR
1.00
1% rule
0.78%
Cash to close
$51,800
Investor read
- This is a 3-bed/2.0-bath single-family listed at $185k.
- At list price, monthly cash flow is $-1 ($-10/yr) — negative.
- To cash-flow at today's rent, offer at most $185k (0.1% below list).
- To meet the 1% rule (rent ≥ 1% of price), the offer needs to be $145k (21.6% below list).
- Only 10 days on market — expect competitive offers; lowballing is unlikely to land.
- Recommended offer: $145k (21.6% below list) — sets the bar for 1% rule.
- In year one you build about $20k of equity ($1k loan paydown + $18k appreciation (10.0% local appreciation)).
- Location reads 82/100 on livability (#10 in MO, #1,296 nationally) — a professional / high-income tenant draw. Strengths: amenities A+, commute A+, cost of living A+; Watch: schools C-, employment D+, crime F.
- Independence 30 (suburban): math 26% / reading 38% proficiency, ranked #252 of 324 in MO (top 78%) — families likely to look elsewhere, expect single-tenant / working-renter base with shorter leases.
- Watch-outs: built in 1920 — expect roof / HVAC / electrical / plumbing capex.
- Market conditions: 46 active listings in the ZIP; 18 comparable units currently listed for rent nearby; rentals at typical pace (median 22d on market — plan ~3-4 weeks tenant-placement turnaround); 4,002 units permitted in Jackson County in 2024 (2,271 in 5+ unit buildings).
- Jackson County population projected at +4% by 2050 — modest demand growth; plan on rents tracking national, not racing it.
- 7 sale attempts since 30y ago; this cycle's ask is 108% above the opening price — seller raised mid-cycle; expect resistance to lowballs.
- At projected returns (10.0% appreciation + 3.0% rent growth), your $52k cash investment doubles in ~3 years — after that, you're playing with house money.
- By year 2, paydown + projected appreciation supports a ~$32k cash-out refi (75% LTV) — recoverable capital for the next deal without selling this one.
- Cap rate 6.3% vs local median 5.0% in Independence — meaningfully above typical; check what's discounted (condition, days-on-market, listing class) to confirm the premium yield is real.
- This rent runs 37% of the median local income ($47k/yr) — at the standard rent-burdened threshold; future hikes will face affordability resistance.
Questions for listing agent
- What do current leases actually rent for vs. the listed asking? Can we see a recent rent roll and the last 12 months of T-12 income?
- Built in 1920 — when were the roof, HVAC, electrical panel, plumbing, and water heater last replaced?
- Is there a deadline driving the sale (1031 exchange, divorce, estate, relocation)? That informs how much negotiation room exists.
- Crime grade is F in this area — have there been break-ins, vandalism, or insurance claims at this property in the last 3 years? What carrier currently insures it and at what premium?
- The area grade is low — what's the realistic commute time and amenity access for the typical tenant pool here? Any planned neighborhood developments (good or bad) we should know about?
- What's the average days-on-market for RENTAL listings here right now (not sales)? A rising rental-DOM trend means longer vacancies and softer asking-rent achievability than the comps imply.
- What's the recent tenant-quality profile in this submarket — average credit score on applications, eviction rate, late-payment / NSF rate, and stable-employment percentage? A property-management company in the area should have these aggregated.
- How much new for-sale + rental construction is in the pipeline within 1–3 miles? Heavy new supply typically softens prices + rents 12–24 months out; constrained supply supports both.
CashFlowRE · CFR-WC8HAC078KAWZC
· Data 1 week ago
cashflowre.app · 2026-05-29