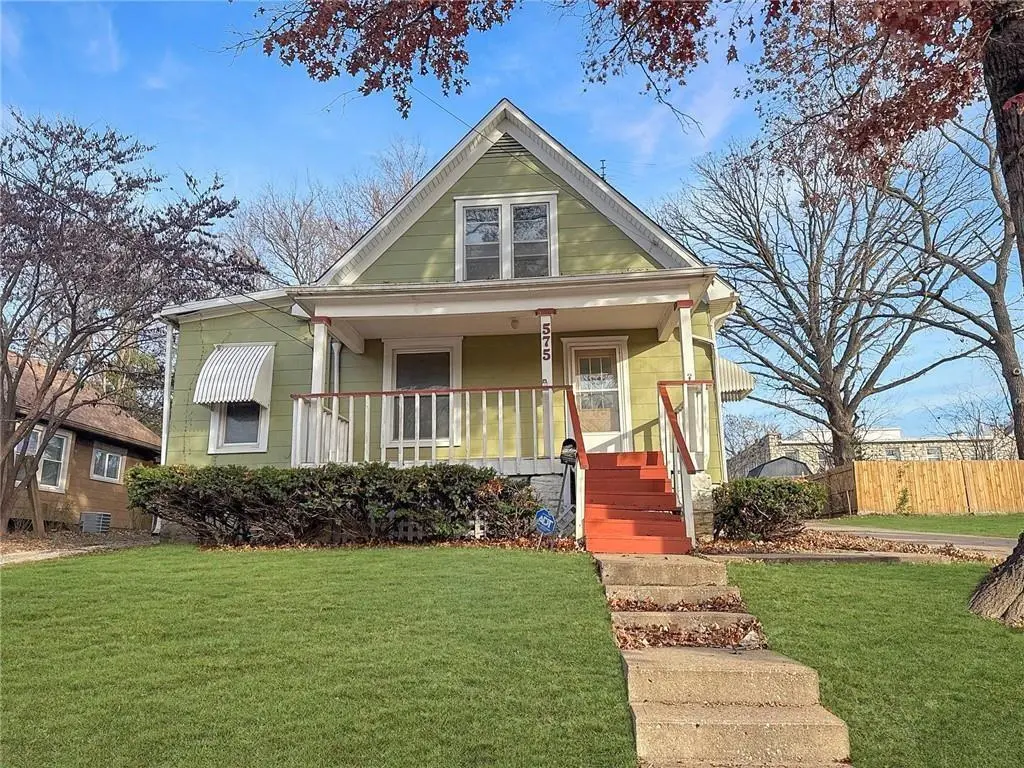
575 S Crescent Ave · Independence, MO
Flood risk 1/10 · Minimal
- FEMA flood zone
- X (unshaded)
- Chance of flooding over 30 yrs
- 0.0%
- Est. flood insurance / yr
- $473 – $860
Fire risk 1/10 · Minimal
- Est. fire insurance / yr
- $1,054 – $1,958
Heat risk 4/10 · Minor
- Hot days now (above 106°F)
- 7 days/yr
- Hot days in 30 yrs
- 17 days/yr
Wind risk 2/10 · Minimal
- Chance of severe wind over 30 yrs
- —
Air-quality risk 3/10 · Minor
- Unhealthy air days now
- 2 days/yr
- Unhealthy air days in 30 yrs
- 3 days/yr
Risk factors via First Street. Map © Google.
Why this score? — see what drove the D grade
The composite is a weighted blend of 9 inputs, each scored 0–100. Each bar is that input's sub-score; the figure is the points it added to the 100-point composite (weight × sub-score).
- Cash flow +13.3/30.0
- Appreciation +10.0/10.0
- Livability +4.1/5.0
- DSCR +4.0/10.0
- 1% rule +2.8/10.0
- Schools +2.7/10.0
- Rent growth +2.5/5.0
- Condition / age +2.5/5.0
- ARV discount +0.0/15.0
$185,000
🖨 Deal sheet 📄 Offer letter ✓ Due diligence
Listing remarks MLS
Come check out this charming home ready for your personal touches! As you step into this inviting 2-bed, 2-bath home offering a bright, open layout and flexible spaces perfect for relaxing or entertaining. A comfortable primary suite, generous secondary bedroom, and well-proportioned living areas create a wonderful place to make your own
Key facts
- 8,276 sq ft lot
- Listed 10 days
Property features AI
Exterior
- Parking: Off-street parking
- Utilities: City/public water (verify); Public sewer
- Home design: Single-family residence; 1.5-story layout; Residential property
- Construction: Shingle siding; Composition roof; Built approximately 101+ years ago
- Exterior features: Lot approximately 0.19 acres; Not in a flood plain
Interior
- Bedrooms: 3 bedrooms
- Bathrooms: 2 full bathrooms
- Heating & cooling: Forced air heating; Cooling via attic fan and window units
- Interior features: Full unfinished stone/rock basement; Attic fan; Window unit(s) for cooling; Forced air heating
Neighborhood map
What this means for you Summary
Snapshot
- This is a 3-bed/2.0-bath single-family listed at $185k.
Deal economics
- At list price, monthly cash flow is $-1 ($-10/yr) — negative.
- To cash-flow at today's rent, offer at most $185k (0.1% below list).
- To meet the 1% rule (rent ≥ 1% of price), the offer needs to be $145k (21.6% below list).
- Recommended offer: $145k (21.6% below list) — sets the bar for 1% rule.
- Cap rate 6.3% vs local median 5.0% in Independence — meaningfully above typical; check what's discounted (condition, days-on-market, listing class) to confirm the premium yield is real.
Location & tenants
- Location reads 82/100 on livability (#10 in MO, #1,296 nationally) — a professional / high-income tenant draw. Strengths: amenities A+, commute A+, cost of living A+; Watch: schools C-, employment D+, crime F.
- Independence 30 (suburban): math 26% / reading 38% proficiency, ranked #252 of 324 in MO (top 78%) — families likely to look elsewhere, expect single-tenant / working-renter base with shorter leases.
- Market conditions: 46 active listings in the ZIP; 18 comparable units currently listed for rent nearby; rentals at typical pace (median 21d on market — plan ~3-4 weeks tenant-placement turnaround); 4,002 units permitted in Jackson County in 2024 (2,271 in 5+ unit buildings).
- This rent runs 37% of the median local income ($47k/yr) — at the standard rent-burdened threshold; future hikes will face affordability resistance.
Forward outlook
- In year one you build about $20k of equity ($1k loan paydown + $18k appreciation (10.0% local appreciation)).
- Jackson County population projected at +4% by 2050 — modest demand growth; plan on rents tracking national, not racing it.
- At projected returns (10.0% appreciation + 3.0% rent growth), your $52k cash investment doubles in ~3 years — after that, you're playing with house money.
- By year 2, paydown + projected appreciation supports a ~$32k cash-out refi (75% LTV) — recoverable capital for the next deal without selling this one.
Negotiation context
- Only 10 days on market — expect competitive offers; lowballing is unlikely to land.
- 7 sale attempts since 30y ago; this cycle's ask is 108% above the opening price — seller raised mid-cycle; expect resistance to lowballs.
Risks & watch-outs
- Watch-outs: built in 1920 — expect roof / HVAC / electrical / plumbing capex.
Questions for the listing agent
- What do current leases actually rent for vs. the listed asking? Can we see a recent rent roll and the last 12 months of T-12 income?
- Built in 1920 — when were the roof, HVAC, electrical panel, plumbing, and water heater last replaced?
- Is there a deadline driving the sale (1031 exchange, divorce, estate, relocation)? That informs how much negotiation room exists.
- Crime grade is F in this area — have there been break-ins, vandalism, or insurance claims at this property in the last 3 years? What carrier currently insures it and at what premium?
- The area grade is low — what's the realistic commute time and amenity access for the typical tenant pool here? Any planned neighborhood developments (good or bad) we should know about?
- What's the average days-on-market for RENTAL listings here right now (not sales)? A rising rental-DOM trend means longer vacancies and softer asking-rent achievability than the comps imply.
- What's the recent tenant-quality profile in this submarket — average credit score on applications, eviction rate, late-payment / NSF rate, and stable-employment percentage? A property-management company in the area should have these aggregated.
- How much new for-sale + rental construction is in the pipeline within 1–3 miles? Heavy new supply typically softens prices + rents 12–24 months out; constrained supply supports both.
Investment metrics
- 1% rule
- 0.78% ✗
- Cap rate
- 6.29%
- Cash-on-cash
- -0.02%
- DSCR
- 1.00
- GRM
- 10.6
CMA / ARV
- ARV (on-the-fly)
- $149,672
- Comps found
- 12
Show comp detail 12 sales within ~0.75 mi
| Address | Dist | Beds/Ba | Sqft | Sold | Price | $/sf | Match |
|---|---|---|---|---|---|---|---|
| 575 Crescent Ave | 0.00mi | 2/2.0 (-1) | 1,412 (0%) | 5mo | $89,000 | $63 | 91 |
| 644 S Lake Dr | 0.58mi | 3/2.0 | 1,500 (+6%) | 1mo | $95,000 | $63 | 62 |
| 641 S Arlington Ave | 0.17mi | 4/1.0 (+1) | 1,245 (-12%) | 4mo | $156,900 | $126 | 60 |
| 9504 E 13th St S | 0.71mi | 3/1.5 | 1,452 (+3%) | 5mo | $199,900 | $138 | 56 |
| 735 S Hawthorne Ave | 0.31mi | 4/1.5 (+1) | 1,613 (+14%) | 3mo | $179,000 | $111 | 52 |
| 10126 Golf Ave | 0.54mi | 3/2.0 | 1,602 (+14%) | 1mo | $149,900 | $94 | 52 |
| 803 S Cedar Ave | 0.43mi | 2/1.0 (-1) | 1,554 (+10%) | 4mo | $95,000 | $61 | 51 |
| 528 S Hardy Ave | 0.54mi | 3/2.0 | 1,607 (+14%) | 2mo | $180,000 | $112 | 50 |
| 9510 E 13th St S | 0.71mi | 3/1.0 | 1,300 (-8%) | 3mo | $138,000 | $106 | 48 |
| 8727 E Lexington Ave | 0.74mi | 2/1.0 (-1) | 1,320 (-6%) | 3mo | $99,900 | $76 | 43 |
| 9735 Winner Rd | 0.67mi | 2/2.0 (-1) | 1,608 (+14%) | 2mo | $134,900 | $84 | 39 |
| 8810 Smart Ave | 0.68mi | 4/4.0 (+1) | 1,260 (-11%) | 1mo | $160,000 | $127 | 36 |
Match score weights: distance 35% · size 25% · config 20% · recency 20%. Top-matched comps best support the ARV.
Projected returns pro-forma
10.0% appreciation · 3.0% rent growth · sell at horizon
- IRR
- 24.3%
- Equity multiple
- 2.94×
- Total profit
- $100,642
- Equity at exit
- $166,663
- IRR
- 21.5%
- Equity multiple
- 6.72×
- Total profit
- $296,300
- Equity at exit
- $359,414
Cash invested: $51,800 (down + closing). Projections, not guarantees.
Landlord ↔ Tenant lean methodology
- Overall (STATE)
- 81 Strongly Landlord-Friendly
- State Missouri
- 81 Strongly Landlord-Friendly · R+10
- County
- — inherits STATE
- City
- — inherits STATE
ZIP-level market 64053
- Home prices YoY
- 17.9%
- Active inventory
- 46
- Price-to-rent
- 10.6×
Monthly cashflow live
- Estimated rent
- $1,451 high interval (Pro) →
- Mortgage (P&I)
- −$970
- Tax from tax record
- −$100 /mo · $1,195/yr
- Insurance
- −$77
- HOA
- −$0
- Vacancy / Maint / Mgmt
- −$305
- Net cashflow
- $-1
Break-even live
UW: 25.0% down · 7.5% · 30yr · 1.5% tax · 5.0% vac · 8.0% maint · 8.0% mgmt
Financing live
Cash to close
- Down payment
- $46,250
- Closing costs
- $5,550
- Reserves months
- —
- Total cash needed
- —
Loan-product check · same deal, 3 products live
Conventional
25% down · 7.5% · 30yr
- Down + closing
- —
- Monthly P&I
- —
- Monthly cashflow
- —
- DSCR
- —
- Eligible?
- —
Personal DTI + credit; lowest rate.
DSCR
20% down · 8.5% · 30yr
- Down + closing
- —
- Monthly P&I
- —
- Monthly cashflow
- —
- DSCR
- —
- Eligible?
- —
No personal income docs; deal must DSCR.
Hard money
10% down · 12.0% · 12mo
- Down + closing
- —
- Monthly P&I
- —
- Monthly cashflow
- —
- DSCR
- —
- Eligible?
- —
Short-term bridge; refi at stabilization.
Rent comps 18 comps
| Address | Beds | Baths | Sqft | Rent | $/sqft | DOM | Units | Dist |
|---|---|---|---|---|---|---|---|---|
| 554 S Arlington Ave Independence, MO | 4.0 | 1.0 | 1161 | $1,395 | $1.20 | 14d | 1 | 0.07mi |
| 600 S Glenwood Ave Unit G Independence, MO | 4.0 | 2.0 | 1600 | $1,675 | $1.05 | 43d | 1 | 0.12mi |
| 600 S Glenwood Ave Unit G-2 Independence, MO | 3.0 | 2.0 | 1600 | $1,650 | $1.03 | 21d | 1 | 0.12mi |
| 576 S Oxford Ave Independence, MO | 3.0 | 2.0 | 1098 | $1,400 | $1.28 | 43d | 1 | 0.13mi |
| 100 S Oxford Ave Independence, MO | 3.0 | 2.0 | 1141 | $1,425 | $1.25 | 44d | 1 | 0.45mi |
| 9528 E Winner Rd Independence, MO | 1.0–3.0 | 1.0 | 730 | $1,099 | $1.51 | 43d | 1 | 0.46mi |
| 10104 E Golf Ave Independence, MO | 3.0 | 2.0 | 1205 | $1,395 | $1.16 | 14d | 1 | 0.47mi |
| 1138 S Glenwood Ave Independence, MO | 2.0 | 1.0 | 1180 | $1,095 | $0.93 | 20d | 1 | 0.54mi |
| 10522 E 10th St S Independence, MO | 2.0 | 1.0 | 1020 | $1,099 | $1.08 | 23d | 1 | 0.79mi |
| 1109 S Appleton Ave Independence, MO | 3.0 | 2.0 | 1200 | $1,195 | $1.00 | 16d | 1 | 0.93mi |
| 10622 E Scarritt Ave Sugar Creek, MO | 4.0 | 1.0 | 1560 | $1,445 | $0.93 | 43d | 1 | 0.96mi |
| 1425 S Northern Blvd Independence, MO | 3.0 | 1.5 | 1275 | $1,200 | $0.94 | 7d | 1 | 1.16mi |
| 11323 E Thompson St Sugar Creek, MO | 3.0 | 2.5 | 1794 | $1,800 | $1.00 | 12d | 1 | 1.33mi |
| 11500 E Anderson St Independence, MO | 3.0 | 2.0 | 1200 | $1,599 | $1.33 | 17d | 1 | 1.37mi |
| 11601 E US Highway 24 Apt DA Independence, MO | 2.0 | 1.0 | 900 | $1,400 | $1.56 | 43d | 1 | 1.43mi |
| 10714 E 19th St S Independence, MO | 2.0 | 1.0 | 1010 | $895 | $0.89 | 3d | 1 | 1.44mi |
| 10323 E 20th St S Independence, MO | 3.0 | 1.0 | 936 | $1,400 | $1.50 | 43d | 1 | 1.48mi |
| 182 Novak St Sugar Creek, MO | 3.0 | 2.0 | 1350 | $1,800 | $1.33 | 17d | 1 | 1.49mi |
Listing history 29 events
-
2026-06-08status $185,000 Pending 10 DOM
-
2026-06-07days on market $185,000 Active Under Contract 10 DOM
-
2026-06-05days on market $185,000 Active Under Contract 7 DOM
-
2026-06-03days on market $185,000 Active Under Contract 6 DOM
-
2026-06-02days on market $185,000 Active Under Contract 5 DOM
-
2026-06-02status $185,000 Active Under Contract 4 DOM
-
2026-06-01days on market $185,000 Active 4 DOM
-
2026-05-31days on market $185,000 Active 3 DOM
-
2026-05-26historical $185,000
-
2026-01-21soldstatus Closed 339-char remark
Show marketing remark (339 chars)
Come check out this charming home ready for your personal touches! As you step into this inviting 2-bed, 2-bath home offering a bright, open layout and flexible spaces perfect for relaxing or entertaining. A comfortable primary suite, generous secondary bedroom, and well-proportioned living areas create a wonderful place to make your own
-
2026-01-20soldstatus Closed 339-char remark
Show marketing remark (339 chars)
Come check out this charming home ready for your personal touches! As you step into this inviting 2-bed, 2-bath home offering a bright, open layout and flexible spaces perfect for relaxing or entertaining. A comfortable primary suite, generous secondary bedroom, and well-proportioned living areas create a wonderful place to make your own
-
2026-01-05status Pending 339-char remark
Show marketing remark (339 chars)
Come check out this charming home ready for your personal touches! As you step into this inviting 2-bed, 2-bath home offering a bright, open layout and flexible spaces perfect for relaxing or entertaining. A comfortable primary suite, generous secondary bedroom, and well-proportioned living areas create a wonderful place to make your own
-
2025-12-07$89,000 Active 339-char remark
Show marketing remark (339 chars)
Come check out this charming home ready for your personal touches! As you step into this inviting 2-bed, 2-bath home offering a bright, open layout and flexible spaces perfect for relaxing or entertaining. A comfortable primary suite, generous secondary bedroom, and well-proportioned living areas create a wonderful place to make your own
-
2024-11-30historical
-
2024-11-03price $125,000
-
2024-08-01price $107,000
-
2024-06-12$126,000 Active
-
2017-04-26soldstatus
-
2016-07-05historical
-
2016-04-05$55,000 Active
-
2015-06-29$57,900
-
1998-09-15soldstatus
-
1998-09-15soldstatus
-
1998-07-29$48,900
-
1997-01-28soldstatus
-
1997-01-27soldstatus
-
1996-09-24$45,950
ⓘ Source: listings_history table (triggers on properties + properties_extension) + one-shot
backfill from property_details.listing_events for pre-trigger history.
Tax reassessment forecast MO · Resets to sale price
- Current annual tax
- $1,195 · $100/mo
- Projected year-2 tax
- $1,794 · $150/mo
- Expected delta
- +$600/yr (+$50/mo · 50.2%)
ⓘ Screening estimate from a state-policy table — verify with the county assessor before closing.
Climate risk First Street
- Flood 1/10 Low FEMA zone X (unshaded) · 0% chance over 30 yrs
- Wildfire 1/10 Low
- Heat 4/10 Moderate 7 d/yr ≥106°F today · 17 d/yr by 30 yrs out
- Wind 2/10 Low
- Air quality 3/10 Moderate 2 unhealthy d/yr today · 3 by 30 yrs out
Nearby sold comps map
Loading sold comps map…
Walkable amenities ~0.75 mi
Loading nearby amenities…
Taxation est. · year 1
- Rental income
- $17,407
- − Mortgage interest
- −$10,363
- − Property taxes
- −$1,195
- − Insurance
- −$925
- − Repairs & maintenance
- −$1,393
- − Management
- −$1,393
- − Depreciation
- −$5,382
- Taxable loss
- −$3,243
- Est. tax savings @ 24.0%
- +$778
- After-tax cash flow
- $768/yr
For passive investors: Depreciation is non-cash, so a rental often shows a tax loss while cash-flowing — sheltering income. Rental losses are passive: they offset passive income freely, and up to $25,000/yr can offset ordinary (W-2) income if you actively participate and your MAGI is under $100k (phasing out to $0 by $150k); unused losses carry forward. On sale, claimed depreciation is recaptured at up to 25%, and gains may owe capital-gains tax (a 1031 exchange can defer both). Figures are a year-1 estimate at your 24.0% rate — not tax advice; consult a CPA.
Schools (NCES district)
- District
- Independence 30
- NCES district ID
- 2915480
- Math proficiency
- 26% ▼ -8.00%
- Reading proficiency
- 38% ▼ -5.00%
- Median HH income
- $41,843
- Composite
- 27.04/100
- National rank
- #7054
- State rank
- #252 of 324 in MO
Livability — Independence
- Score
- 82/100
- State rank
- #10
- US rank
- #1296
Category grades
Schools grade is shown separately in the Schools card above.
Census & demographics
- Census place
- Independence, MO
- County
- Jackson County · 687,798 people
- City population
- 117,675
- Metro
- Kansas City, MO-KS
- Population (ZIP)
- 6,775
- Household income
- $47,285
- Rent vs Own
- Severe rent burden
- 330.0
Population outlook (Jackson County) Hauer SSP2
- Today (2025)
- 719,589 people
- By 2030
- 731,456 · +1.6%
- By 2040
- 746,689 · +3.8%
- By 2050
- 749,289 · +4.1%
- By 2075
- 736,227 · +2.3%
- By 2100
- 668,210 · -7.1%
Race, ethnicity, and origin ACS 2023
- Neighborhood character
- Diverse neighborhood (Simpson 0.57)
- Race & ethnicity
- White 59% Hispanic / Latino 28% Two or more races 14% Black 9% Native American 3%
- Hispanic origin (detail)
- Mexican 25%
- Common ancestry
- Italian 12% Lithuanian 3% Slovak 1%
- Foreign-born
- 12% · Canada, China
- Languages at home
- 78% English-only · Spanish 21%
Political lean MEDSL · Jackson
- 2024 margin
- D (+19.3) · D 58.9% · R 39.5% · Other 1.6%
- 2008→2024 swing
- -6.1pp toward R · 2008: 25.4pp · 2024: 19.3pp
- All cycles
- 2024: D+19.3 2020: D+22.0 2016: D+16.6 2012: D+19.0 2008: D+25.4
Not yet ingested
- Civics
- —
Market trends
- HPI YoY
- ▲ 52.69%
- Current HPI
- 347.9512
- Rent YoY
- —
- Metro
- Kansas City, MO-KS
- State GDP YoY
- ▲ 1.84%
- F500 in state
- 20
Industry mix (Fortune 500 HQ in MO)
| Industry | F500 HQs | Revenue |
|---|---|---|
| Healthcare | 1 | $163B |
|
||
| Insurance | 1 | $21B |
|
||
| Industrial Technology | 1 | $17B |
|
||
| Retail | 1 | $16B |
|
||
| Industrial Distribution | 1 | $10B |
|
||
| Utilities | 1 | $9B |
|
||
Price history
+302.6% since first listed21 events — show timeline
- 2026-05-26 Coming Soon $185,000 Heartland MLS as Distributed by MLS Grid
- 2026-01-21 Sold (MLS) — MARIS as Distributed by MLS Grid
- 2026-01-20 Sold (MLS) — Heartland MLS as Distributed by MLS Grid
- 2026-01-05 Pending — MARIS as Distributed by MLS Grid
- 2026-01-05 Pending — Heartland MLS as Distributed by MLS Grid
- 2025-12-07 Listed $89,000 Heartland MLS as Distributed by MLS Grid
- 2025-12-07 Listed $89,000 MARIS as Distributed by MLS Grid
- 2024-11-30 Listing Removed — Heartland MLS as Distributed by MLS Grid
- 2024-11-03 Price Changed $125,000 Heartland MLS as Distributed by MLS Grid
- 2024-08-01 Price Changed $107,000 Heartland MLS as Distributed by MLS Grid
- 2024-06-12 Listed $126,000 Heartland MLS as Distributed by MLS Grid
- 2017-04-26 Sold (Public Records) — Public Records
- 2016-07-05 Listing Removed — Heartland MLS as Distributed by MLS Grid
- 2016-04-05 Listed $55,000 Heartland MLS as Distributed by MLS Grid
- 2015-06-29 Listed $57,900 Heartland MLS as Distributed by MLS Grid
- 1998-09-15 Sold (Public Records) — Public Records
- 1998-09-15 Sold (MLS) — Heartland MLS as Distributed by MLS Grid
- 1998-07-29 Listed $48,900 Heartland MLS as Distributed by MLS Grid
- 1997-01-28 Sold (Public Records) — Public Records
- 1997-01-27 Sold (MLS) — Heartland MLS as Distributed by MLS Grid
- 1996-09-24 Listed $45,950 Heartland MLS as Distributed by MLS Grid
Property tax history
+3.9%/yrLatest (2025): $1,195 · -5.7% YoY. Source: county tax records.
Cash-flow waterfall
monthlySold comps — $/sqft
last 12 mo · ≤1 miLoading sold comps…